








AI Observability, How to Monitor LLM Applications in Production

Saurav Jagdale
Technical Lead, Unico Connect
In this article
- Quick Answer
- Key Takeaways
- What AI Observability Means for Production LLM Systems
- Why Standard APM Is Not Enough for LLM Applications
- The Observability Stack Every LLM Team Needs Before Scale
- What to Monitor in Production
- How to Set Up AI Observability in Practice
- How Unico Connect Monitors Production AI Workflows
- LangSmith, Langfuse, and Broader Observability Tooling
- Instrument on OpenTelemetry to Avoid Lock In
- Common Observability Mistakes in LLM Production
- Frequently Asked Questions
- Build Production AI You Can Actually Operate
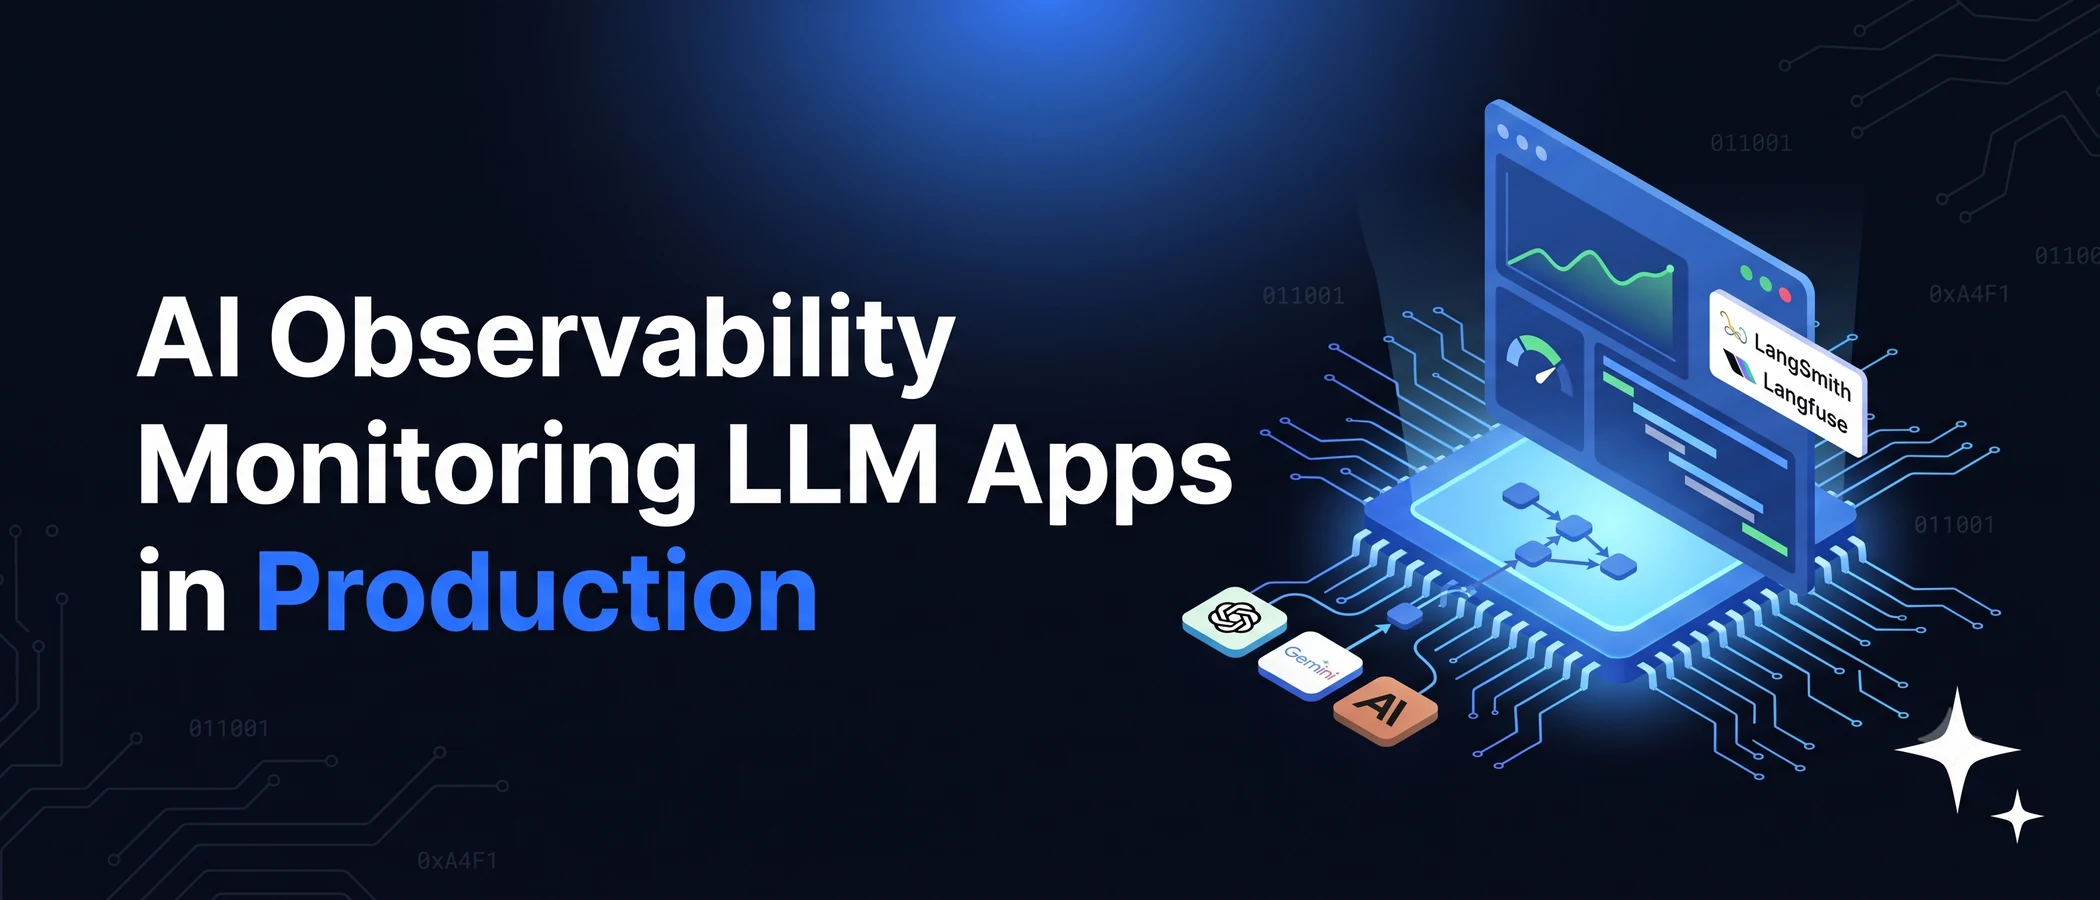
AI observability is the practice of understanding what happened inside a live LLM workflow, why it happened, and where it slowed down, failed, or drifted. Monitoring LLM applications in production means tracking traces, logs, latency, cost, drift, and workflow failures across the full request path, where the model response is only one step. Model evaluation is a separate discipline and stays out of scope here. What follows is written for teams already shipping live AI workflows who need visibility they can use to run them reliably.
Quick Answer
AI observability for an LLM application in production means tracing the full request path, including retrieval, tool calls, and downstream actions as well as the model call, so you can explain why a request behaved the way it did. Monitor traces, latency, cost, drift, and tool reliability, capture usable metadata on every request, and tie drift monitoring to releases. Standard APM covers uptime and infrastructure but misses prompt changes, fallback paths, and tool call chains. Dedicated tools like LangSmith and Langfuse add the trace level visibility that general monitoring lacks, and OpenTelemetry now publishes semantic conventions for generative AI so traces stay portable between them. At Unico Connect we run latency, cost, and drift monitoring as ordinary operations work, so a new release never quietly inflates daily provider spend for a client.
Key Takeaways
- Treat observability as the visibility to explain why a live request behaved the way it did across the model call, retrieval, tool calls, and downstream actions. Uptime monitoring and evaluation answer different questions, so do not expect either to stand in for it.
- Keep your APM and add LLM tracing on top. A request can succeed at the API level while quietly getting slow and expensive through a fallback path and a prompt that doubled in size, and APM alone will still log it as a success.
- Attach request ID, prompt version, model and version, route, tool calls, step timings, token usage, fallback status, and outcome to every request. Without them, incident review and cost analysis turn into guessing which prompt, route, or model version caused the problem.
- Watch latency and cost together and tie drift monitoring to releases, since most regressions show up right after a prompt, model, routing, or retrieval change. Catching those regressions before release gets a post of its own.
- Instrument on OpenTelemetry so you can switch tools without reworking your code. Standard APM, AI native tracing tools like LangSmith, Langfuse, Arize Phoenix, and MLflow, and AI gateways like Helicone and Portkey now share the OpenTelemetry GenAI standard.
What AI Observability Means for Production LLM Systems
AI observability is broader than uptime monitoring and narrower than full model evaluation. In production LLM systems it means having enough visibility to explain why a request behaved the way it did, which goes further than checking whether the endpoint returned successfully. That covers the model call, the retrieval step, tool calls, routing logic, and any downstream action the system triggered. What you need to understand is how the request moved through the system, and the response content is only one part of that.
Live LLM workflows keep changing with traffic patterns, prompt updates, model routing, and release cycles, so a system can be technically healthy while still producing expensive, slow, or inconsistent outcomes. When the question is quality, treat continuous AI evaluations as their own discipline and run them asynchronously so they never block a live request.
Why Standard APM Is Not Enough for LLM Applications
Standard APM still earns its place for uptime, infrastructure health, service errors, and broad latency alerts. It does not show the shape of an LLM workflow well, meaning prompt version changes, context growth, fallback behaviour, tool call chains, or the way routing logic shifts after a release, and those are usually the failure modes that hurt in production AI.
A request can succeed at the API level and still be operationally bad. Picture a customer support workflow that returns a correct looking answer, but only after a fallback path, several tool calls, and a prompt expansion that doubles token usage and adds a few seconds of latency. APM records a success. LLM observability shows a system that is getting expensive and unreliable, which is why teams need tracing and LLM logging on top of classic endpoint monitoring. The same lesson shows up in why so many AI projects miss their return and in the gap between a model and a production system.
The Observability Stack Every LLM Team Needs Before Scale
The strongest teams add telemetry hooks from day one instead of bolting observability onto a live workflow later, because once traffic grows it becomes much harder to reconstruct what happened in a request path after the fact.
Map the request lifecycle end to end
Start by mapping the full path, from input, preprocessing, retrieval, and prompt assembly to the model call, tool call, output, and downstream action. Each step can slow down or fail independently. In multi step systems the request is a chain of events, and LLM tracing only becomes useful when every link in that chain is visible.
Decide what metadata to capture on every request
Every production request should carry enough metadata to make debugging and cost analysis possible. That usually includes request ID, prompt version, model and version, route, tool calls, step timings, token usage, fallback status, and final outcome. Get this metadata right before you spend time on dashboard polish, because without it teams end up guessing which prompt, route, or model version caused a problem.
Set logging, redaction, and retention rules early
Decide in advance what gets stored, summarized, redacted, or excluded. Production logs often contain sensitive business data or personal information, so define PII handling, access controls, and retention windows before rollout. Good LLM logging is selective and captures enough to support incident review without adding needless risk or storage bloat. In agent systems these rules feed straight into how you govern agents at enterprise scale.
What to Monitor in Production
A monitoring signal is only worth collecting if it shows how the workflow behaves in production and warns you when something is going wrong.
Trace visibility and request flow signals
Trace visibility shows step level timing, workflow branching, tool sequence, fallback paths, and stuck states. In a multi step LLM system that is worth more than a single response log, because problems rarely sit in one line of code or one model call. A request may spend most of its time in retrieval, in a tool call, or waiting in a queue before the model even responds, and tracing helps show where the workflow is slowing down or fragmenting.
Latency and cost signals
Latency monitoring should include total latency, time to first token, retrieval delay, tool call delay, queue time, and tail latency. On the cost side, track cost per request, cost per route, model level cost, fallback cost, and token growth. Watch the two together, because one often drives the other. A change that improves answer quality but expands context can quietly increase spend and latency at the same time. When you run several models in production, watch cost and latency per route, since a routing change can move both.
Drift, tool reliability, and workflow breakdown signals
AI drift monitoring covers more than model quality. In production, drift also shows up as prompt drift, routing drift, context drift, schema drift, and changes in tool behaviour. Reliability signals include retries, timeouts, malformed outputs, failed handoffs, and spike patterns after a release, and together they warn you that the system is becoming unstable even while the model response still looks plausible on the surface.
How to Set Up AI Observability in Practice
Implementation goes best when teams treat observability as part of the application itself. Because LLM workflows are distributed and change over time, the mechanics matter.
Instrument traces across the full request path
Use trace IDs and spans to connect retrieval, model calls, tools, and downstream systems into one visible flow, and attach step level timing to each segment so teams can see where delays happen. A simple trace diagram or a redacted production example is often the best way to confirm the full path is covered and the trace tells the complete story.
Standardize structured logs and metadata
Structured logs should use consistent event names, JSON payloads, correlation IDs, and environment tags, which makes it easier to join logs to traces during incident review. You do not need to log everything, only to have the right metadata on hand when a workflow behaves unexpectedly. LLM logging becomes much more valuable when you can search and correlate it cleanly.
Build dashboards and alerts for latency, cost, and failures
Organize dashboards by workflow, model, environment, language, or route, depending on how the application is used, and set alerts for spend anomalies, latency spikes, failure rate changes, and fallback surges. Route level views matter because averages can hide the problem. One workflow path may be healthy while another is drifting badly.
Sample detailed traces at high volume
At high traffic, full trace capture on every request gets expensive fast. A common pattern is to log basic metrics on all requests and capture detailed traces on a sample, plus every error and every slow request. That keeps the storage bill sane while preserving enough depth to reconstruct incidents.
Make drift monitoring release aware
Tie drift monitoring to prompt changes, routing updates, provider switches, and retrieval or data updates, so that when behaviour changes after a release the monitoring system makes it visible quickly. Wired this way, observability becomes a working part of release management.
Assign owners and a review cadence
Someone needs to own dashboard review, alert triage, incident routing, and release checks. A practical cadence is daily triage, weekly review, and release based checks. Without ownership, observability becomes a set of graphs nobody acts on.
How Unico Connect Monitors Production AI Workflows
We treat observability as a workflow level concern that reaches well past the model call, and we build it in before traffic grows.
How we instrument traces in multi step AI workflows
We enforce trace coverage across the user input, context assembly, the model calls, the tool calls, and the downstream actions, so no execution path stays hidden. When a request behaves oddly, the trace shows every step it took.
How we watch latency, cost, and route changes after a release
After any prompt, model, or workflow change, we monitor latency shifts, token cost changes, and route behaviour right away. We keep latency, cost, and drift monitoring part of day to day operations, so no release quietly pushes up daily provider spend for a client.
How we handle incidents in live AI workflows
When a live workflow behaves unexpectedly, we rely on automated alerting, log review, and release aware monitoring to escalate fast. Standardized logging lets the team isolate the exact point of failure and restore service without guesswork.
Most production AI incidents are not model failures. They are a fallback path, a prompt that grew, or a tool call that started timing out. If the trace does not show the whole request, the team is debugging blind. Instrument the full path before traffic grows, not after.
Saurav Jagdale, Technical Lead, Unico Connect
LangSmith, Langfuse, and Broader Observability Tooling
The Business Research Company puts the LLM observability platform market at 2.69 billion dollars in 2026 and projects 9.26 billion by 2030, and the tools in it do different jobs. Which one fits depends on how much tracing depth, analytics, and workflow debugging a team needs. It also depends on how much control the team wants over deployment and data handling, which is where open source and vendor managed options split.
When LangSmith is the better fit
LangSmith fits teams that want strong trace visibility, chain inspection, and developer oriented debugging inside LangChain and LangGraph workflows. It is proprietary and self hosting comes as an Enterprise option instead of the default, though OpenTelemetry support means it now works beyond LangChain too. Pick it when the main job is inspecting request paths and speeding up iterative development.
When Langfuse is the better fit
Langfuse is often a better fit when teams want tracing, analytics, and broader operational visibility in a production setting. It is open source, supports self hosting on an open storage stack, and is built around application tracing, token usage, latency, and cost tracking, with OpenTelemetry support. That gives teams more control over instrumentation and data residency, and self hosting can lower cost at high trace volume.
When broader observability stacks still matter
LLM production monitoring tools run alongside general app, infrastructure, and alerting systems and fill in what those miss. LLM tools show request level behaviour, while broader observability stacks show system health, infrastructure saturation, and service level incidents. A third camp, AI gateways such as Helicone and Portkey, sits between your app and the providers for routing, caching, and cost tracking. Most production teams need more than one of these.
LLM observability tooling layers compared
| Tooling layer | Primary focus | Key metrics tracked | When to use it |
|---|---|---|---|
| Standard APM (New Relic, Dynatrace) | Platform and infrastructure health | Uptime, CPU and memory saturation, 5xx error rates | Baseline requirement for every production service |
| LangSmith | Deep trace visibility and developer debugging | Step level timing, prompt versions, chain inspection | Strongest inside LangChain and LangGraph workflows, and now supports OpenTelemetry for broader use |
| Langfuse | Operational visibility and cost control, open source | Token usage, cost, latency, self hosted data residency | Teams that want self hosting and control over their telemetry data |
| Arize Phoenix | Open source tracing and evaluation, built on OpenTelemetry | Spans, RAG metrics, hallucination and embedding drift detection | Teams that want deep tracing and evals without sending data to a third party |
| MLflow | Open source tracing across the full model and agent lifecycle | Inputs, outputs, prompt versions, step traces, token usage | Teams that want an open stack, with OpenTelemetry as the default substrate |
| Datadog LLM Observability | Enterprise LLM monitoring unified with existing APM | LLM spans, latency, cost, errors, native OpenTelemetry GenAI support | Teams already on Datadog that want LLM and infrastructure in one place |
| AI gateways (Helicone, Portkey) | Routing, caching, and cost control at the proxy layer | Cost per request, cache hit rate, provider routing | Teams that want cost control and routing with little code change |
Instrument on OpenTelemetry to Avoid Lock In
The biggest shift in 2026 came from a standard. OpenTelemetry became a graduated CNCF project in May 2026, and its GenAI Semantic Conventions define exactly which span attributes describe an LLM call, an agent step, and token usage, and tools estimate cost from those token counts. Datadog, MLflow, Langfuse, and LangSmith all support it, and MLflow now uses OpenTelemetry as its default tracing substrate.
Instrument your LLM workflow on OpenTelemetry rather than a single vendor SDK and you can move traces between tools without instrumenting your code again, which protects you from lock in while the market keeps shifting. Plan for one caveat. The GenAI conventions are still experimental and not yet at a stable release, so attribute names can change. Opting in to the latest names also stops the old ones, so update dashboards and queries in the same release.
Common Observability Mistakes in LLM Production
The most common mistakes are operational. Teams skip trace IDs, which makes incidents hard to reconstruct, or ignore prompt or version tracking, which makes release comparisons impossible. They log too much or too little, so either storage becomes noisy or the data is not useful. Some rely only on provider dashboards and miss route level anomalies. Others track averages and miss the spikes where the real problem hides. The last is ownership. When no one is responsible for incident review, the same issues keep coming back. If you are building agent systems, designing orchestration and identity up front makes all of this far easier to instrument.
Frequently Asked Questions
What is AI observability in a production LLM application?
AI observability is the ability to understand what happened inside a live LLM workflow, why it happened, and where the flow slowed down or failed. In practice that means watching traces, logs, latency, cost, drift, and workflow behaviour across the whole request, model response included.
What should teams log for each LLM request in production?
At minimum, request ID, prompt version, model and version, route, step timings, tool calls, token usage, fallback status, and final outcome. That metadata is what makes incident review and cost analysis possible.
What should a latency and cost dashboard show for live LLM workflows?
It should show total latency, time to first token, retrieval delay, tool call delay, tail latency, cost per request, cost per route, and token growth. Route level views are important because averages can hide expensive or slow paths.
How is drift monitoring different from standard application monitoring?
Standard application monitoring watches service health and errors, while drift monitoring looks for changes in behaviour after prompt updates, routing changes, provider changes, or retrieval updates. Its job is to tell you whether the workflow still behaves the same way after a release.
When should teams use LangSmith or Langfuse instead of general monitoring tools?
Use them when the team needs LLM tracing, prompt level visibility, token and cost tracking, or workflow debugging that general monitoring tools do not provide. Keep your general observability running alongside them, since live LLM systems need both.
Should teams use OpenTelemetry for LLM observability?
In most cases, yes. OpenTelemetry became a graduated CNCF project in 2026, and its GenAI Semantic Conventions are the standard that LangSmith, Langfuse, MLflow, Arize Phoenix, and Datadog now build on. Instrumenting on OpenTelemetry lets you move traces between tools without changing your code, though the GenAI conventions are still evolving, so expect some attribute names to change over time.
Build Production AI You Can Actually Operate
If you are shipping LLM workflows and want observability built in from the start, our agentic AI development and AI development services cover instrumentation, tracing, and release aware monitoring as part of the build. The same instrumentation is what makes a model swap measurable rather than a guess, which we work through in how to choose an AI model for production. You can also hire AI engineers to extend your own team.