


The AI-Native Difference
Most companies are still drowning in data but starving for insights. We build analytics systems that don't just report what happened, but predict what's coming next.
Traditional Data Analytics
Spreadsheets emailed around the team
Critical business data lives in Excel files shared via email. No single source of truth, no version control, no real-time access.
Reports that take weeks to produce
Analysts manually pull data from multiple systems, clean it, and format reports. By the time they're ready, the data is already outdated.
Data siloed across departments
Sales, marketing, operations, and finance each maintain separate data stores with no connection between them.
Backward-looking reports only
Analytics tells you what already happened but offers no ability to forecast trends or predict what comes next.
Insights arrive too late to act on
Monthly and quarterly reporting cycles mean decision-makers see problems weeks after they started impacting the business.
AI-Native Analytics (How We Build)
Self-service dashboards with real-time data
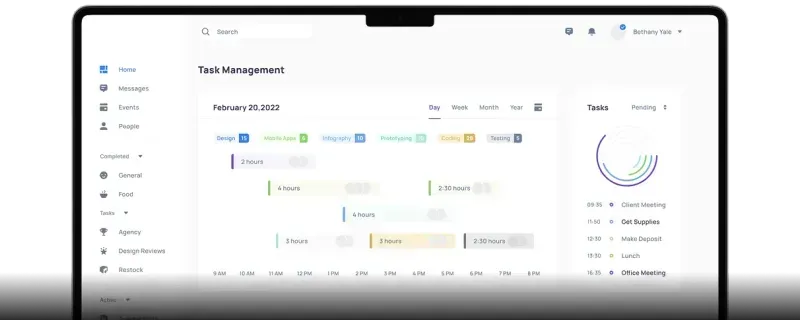
Interactive Power BI and Tableau dashboards that anyone on the team can explore without waiting for an analyst to run a query.
Automated pipelines that refresh continuously
ETL/ELT pipelines pull data from all your sources, transform it, and load it into a unified warehouse on schedule or in real time.
Unified data warehouse across all sources
BigQuery, Snowflake, or PostgreSQL as your single source of truth. Every department sees the same numbers.
Predictive models that forecast what's coming next
Machine learning trained on your historical data to predict demand, churn, revenue trends, and operational risks before they happen.q
Alerts and anomaly detection that surface issues instantly
AI monitors your data streams 24/7 and notifies your team the moment something deviates from expected patterns.
Development Capabilities
Data Pipeline & Warehouse Design
Build automated ETL/ELT pipelines that pull data from all your sources into a unified warehouse. Clean, transformed, and ready for analysis in real time.
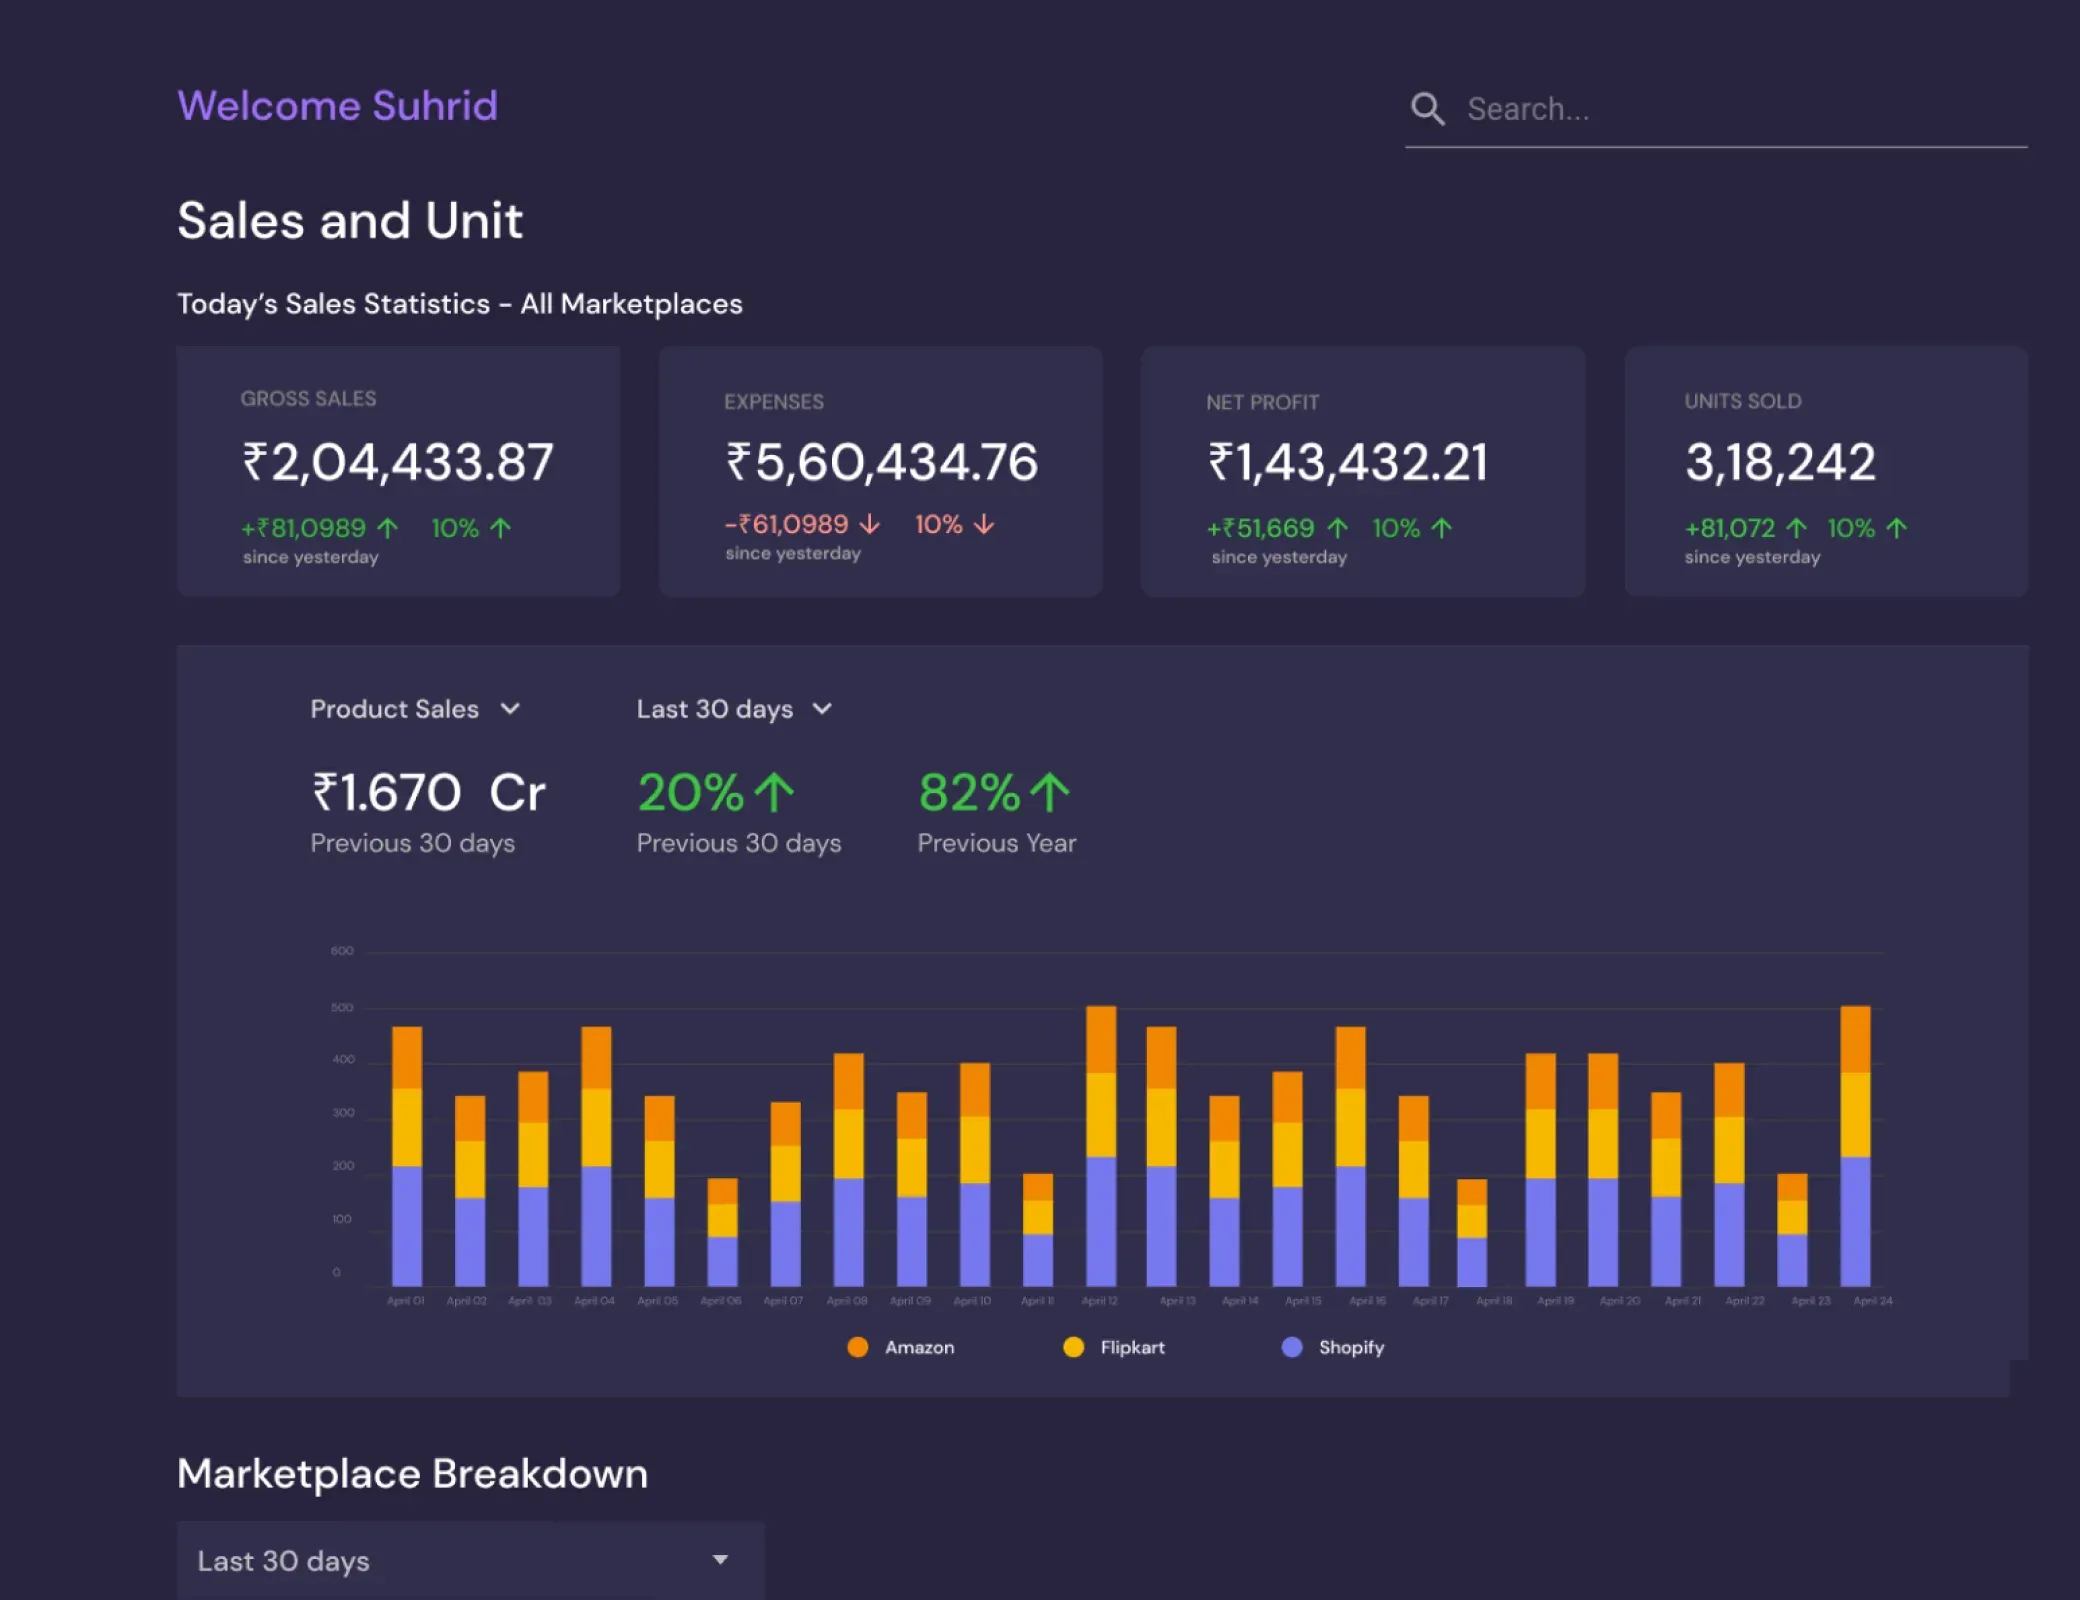
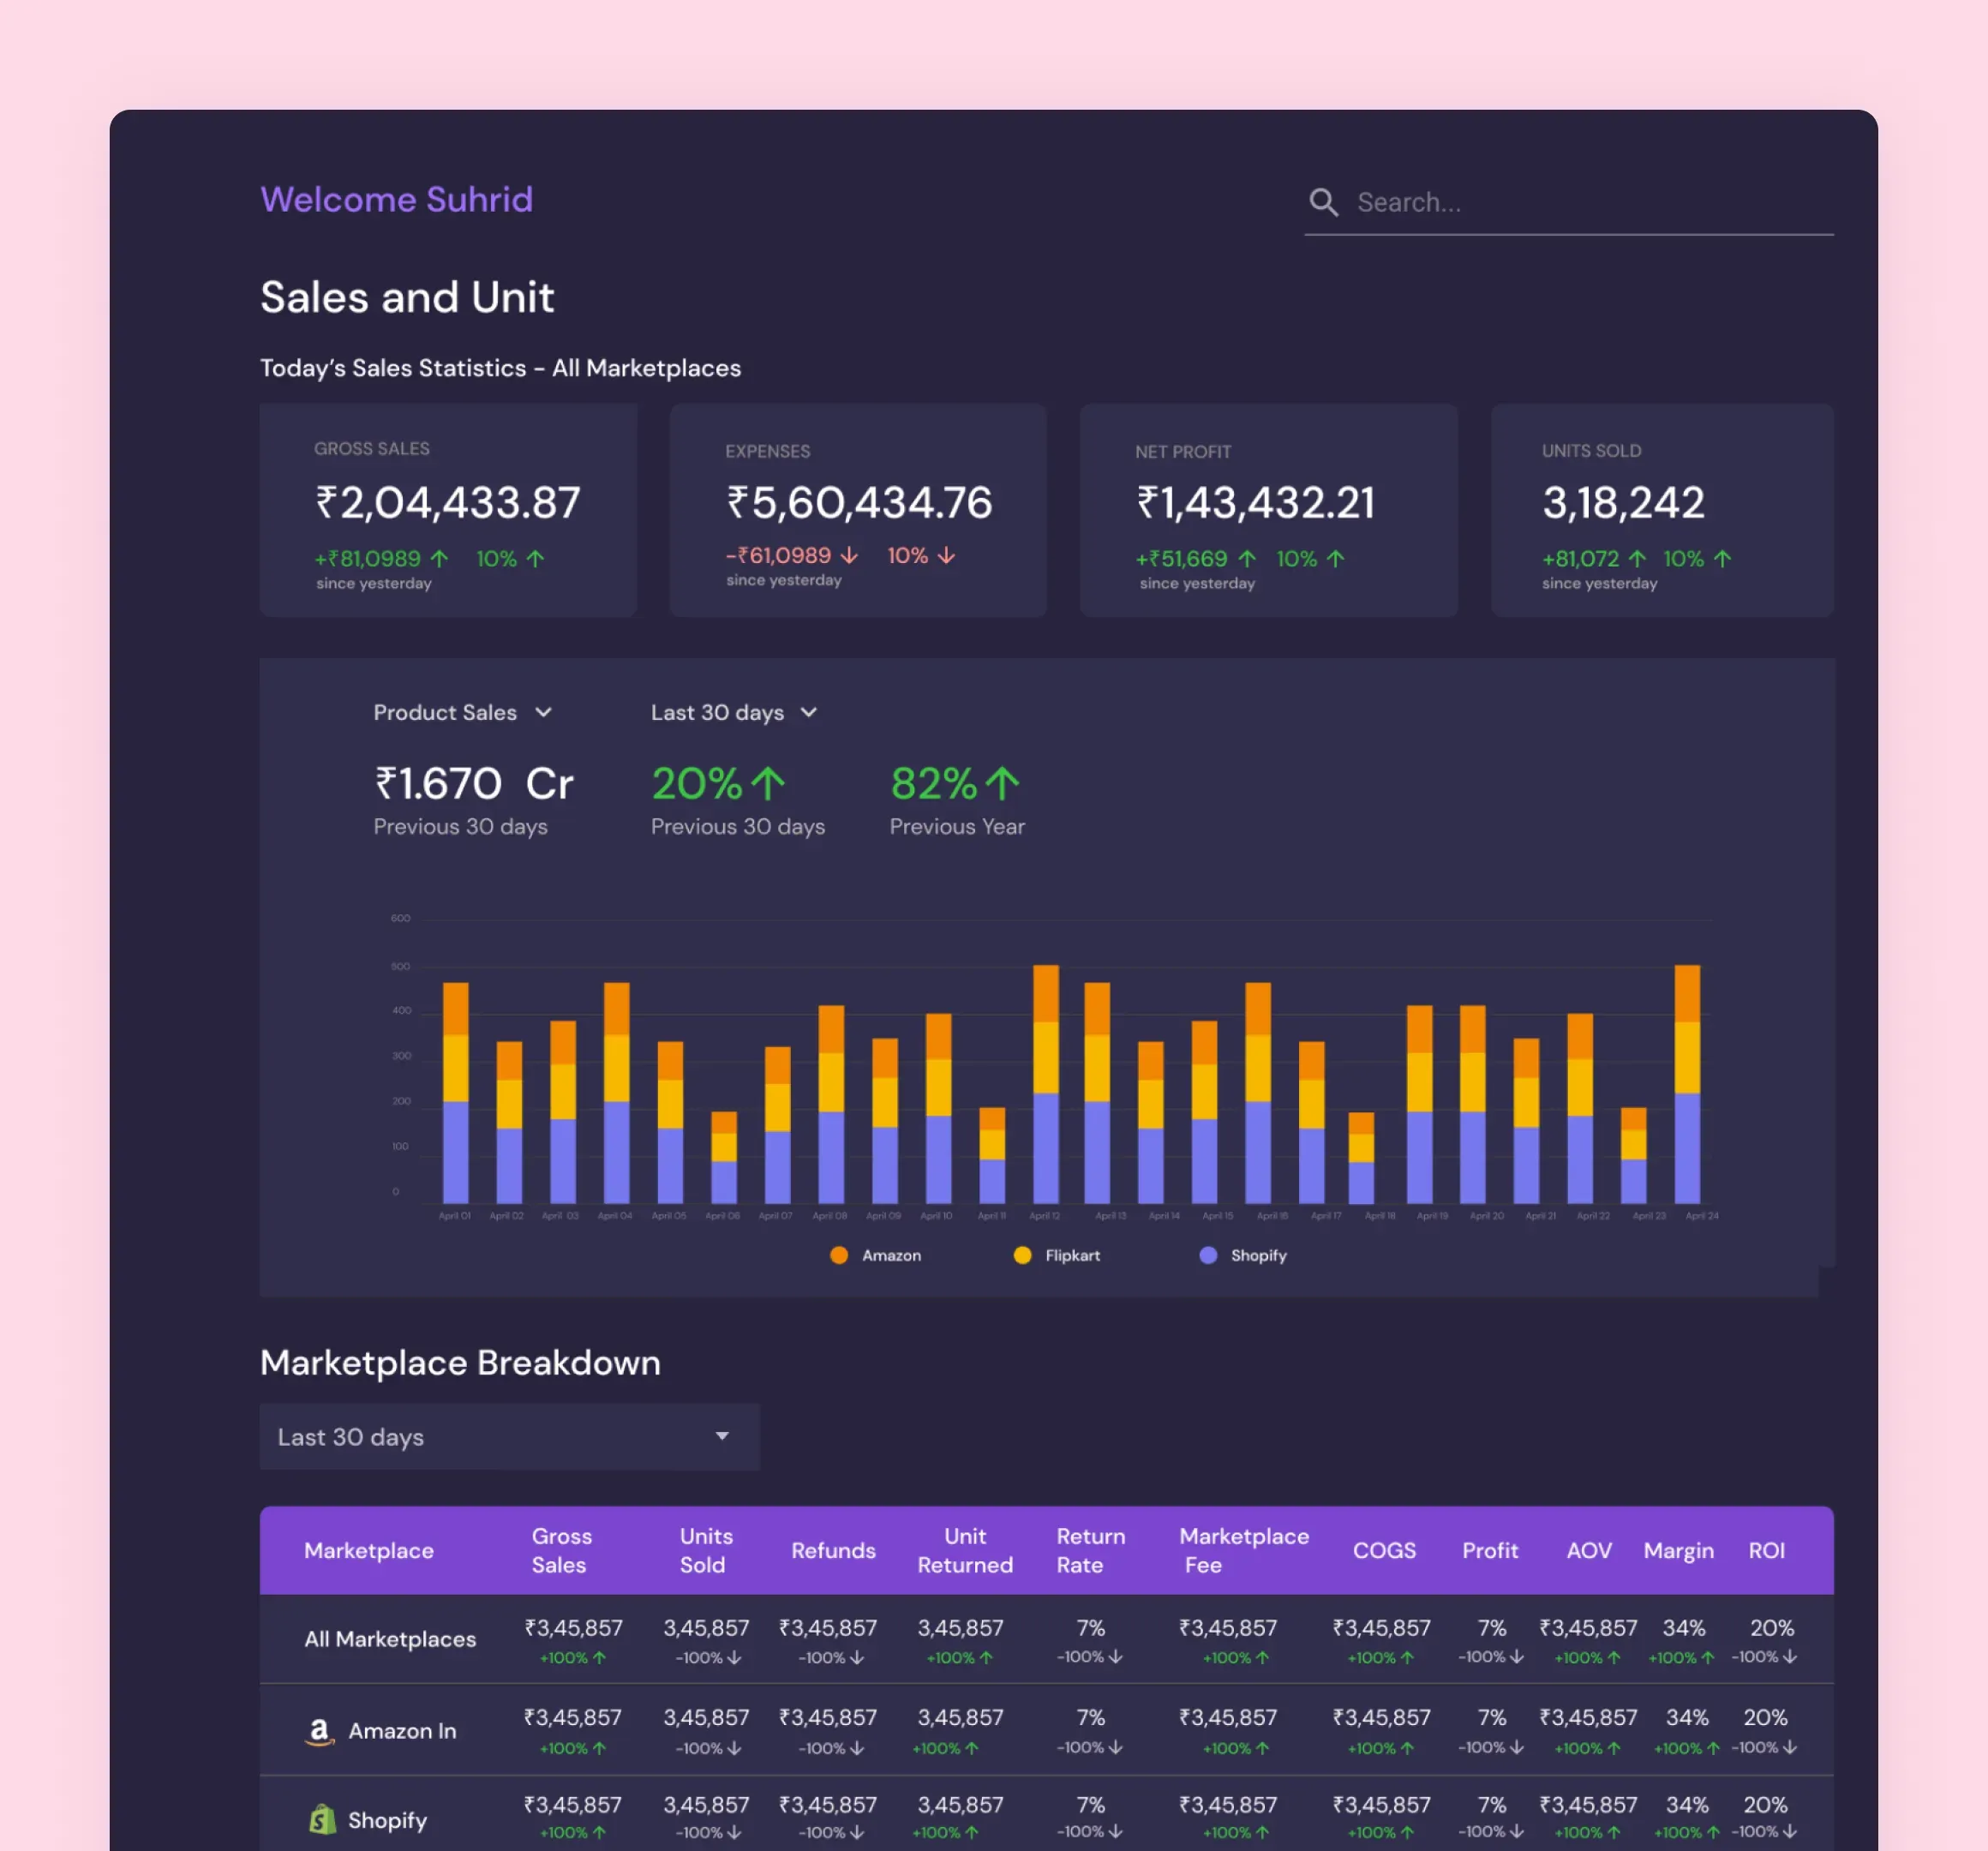
Business Intelligence Dashboards
Interactive Power BI and Tableau dashboards tailored to your KPIs. Role-based views for executives, managers, and operations teams with self-service drill-downs.
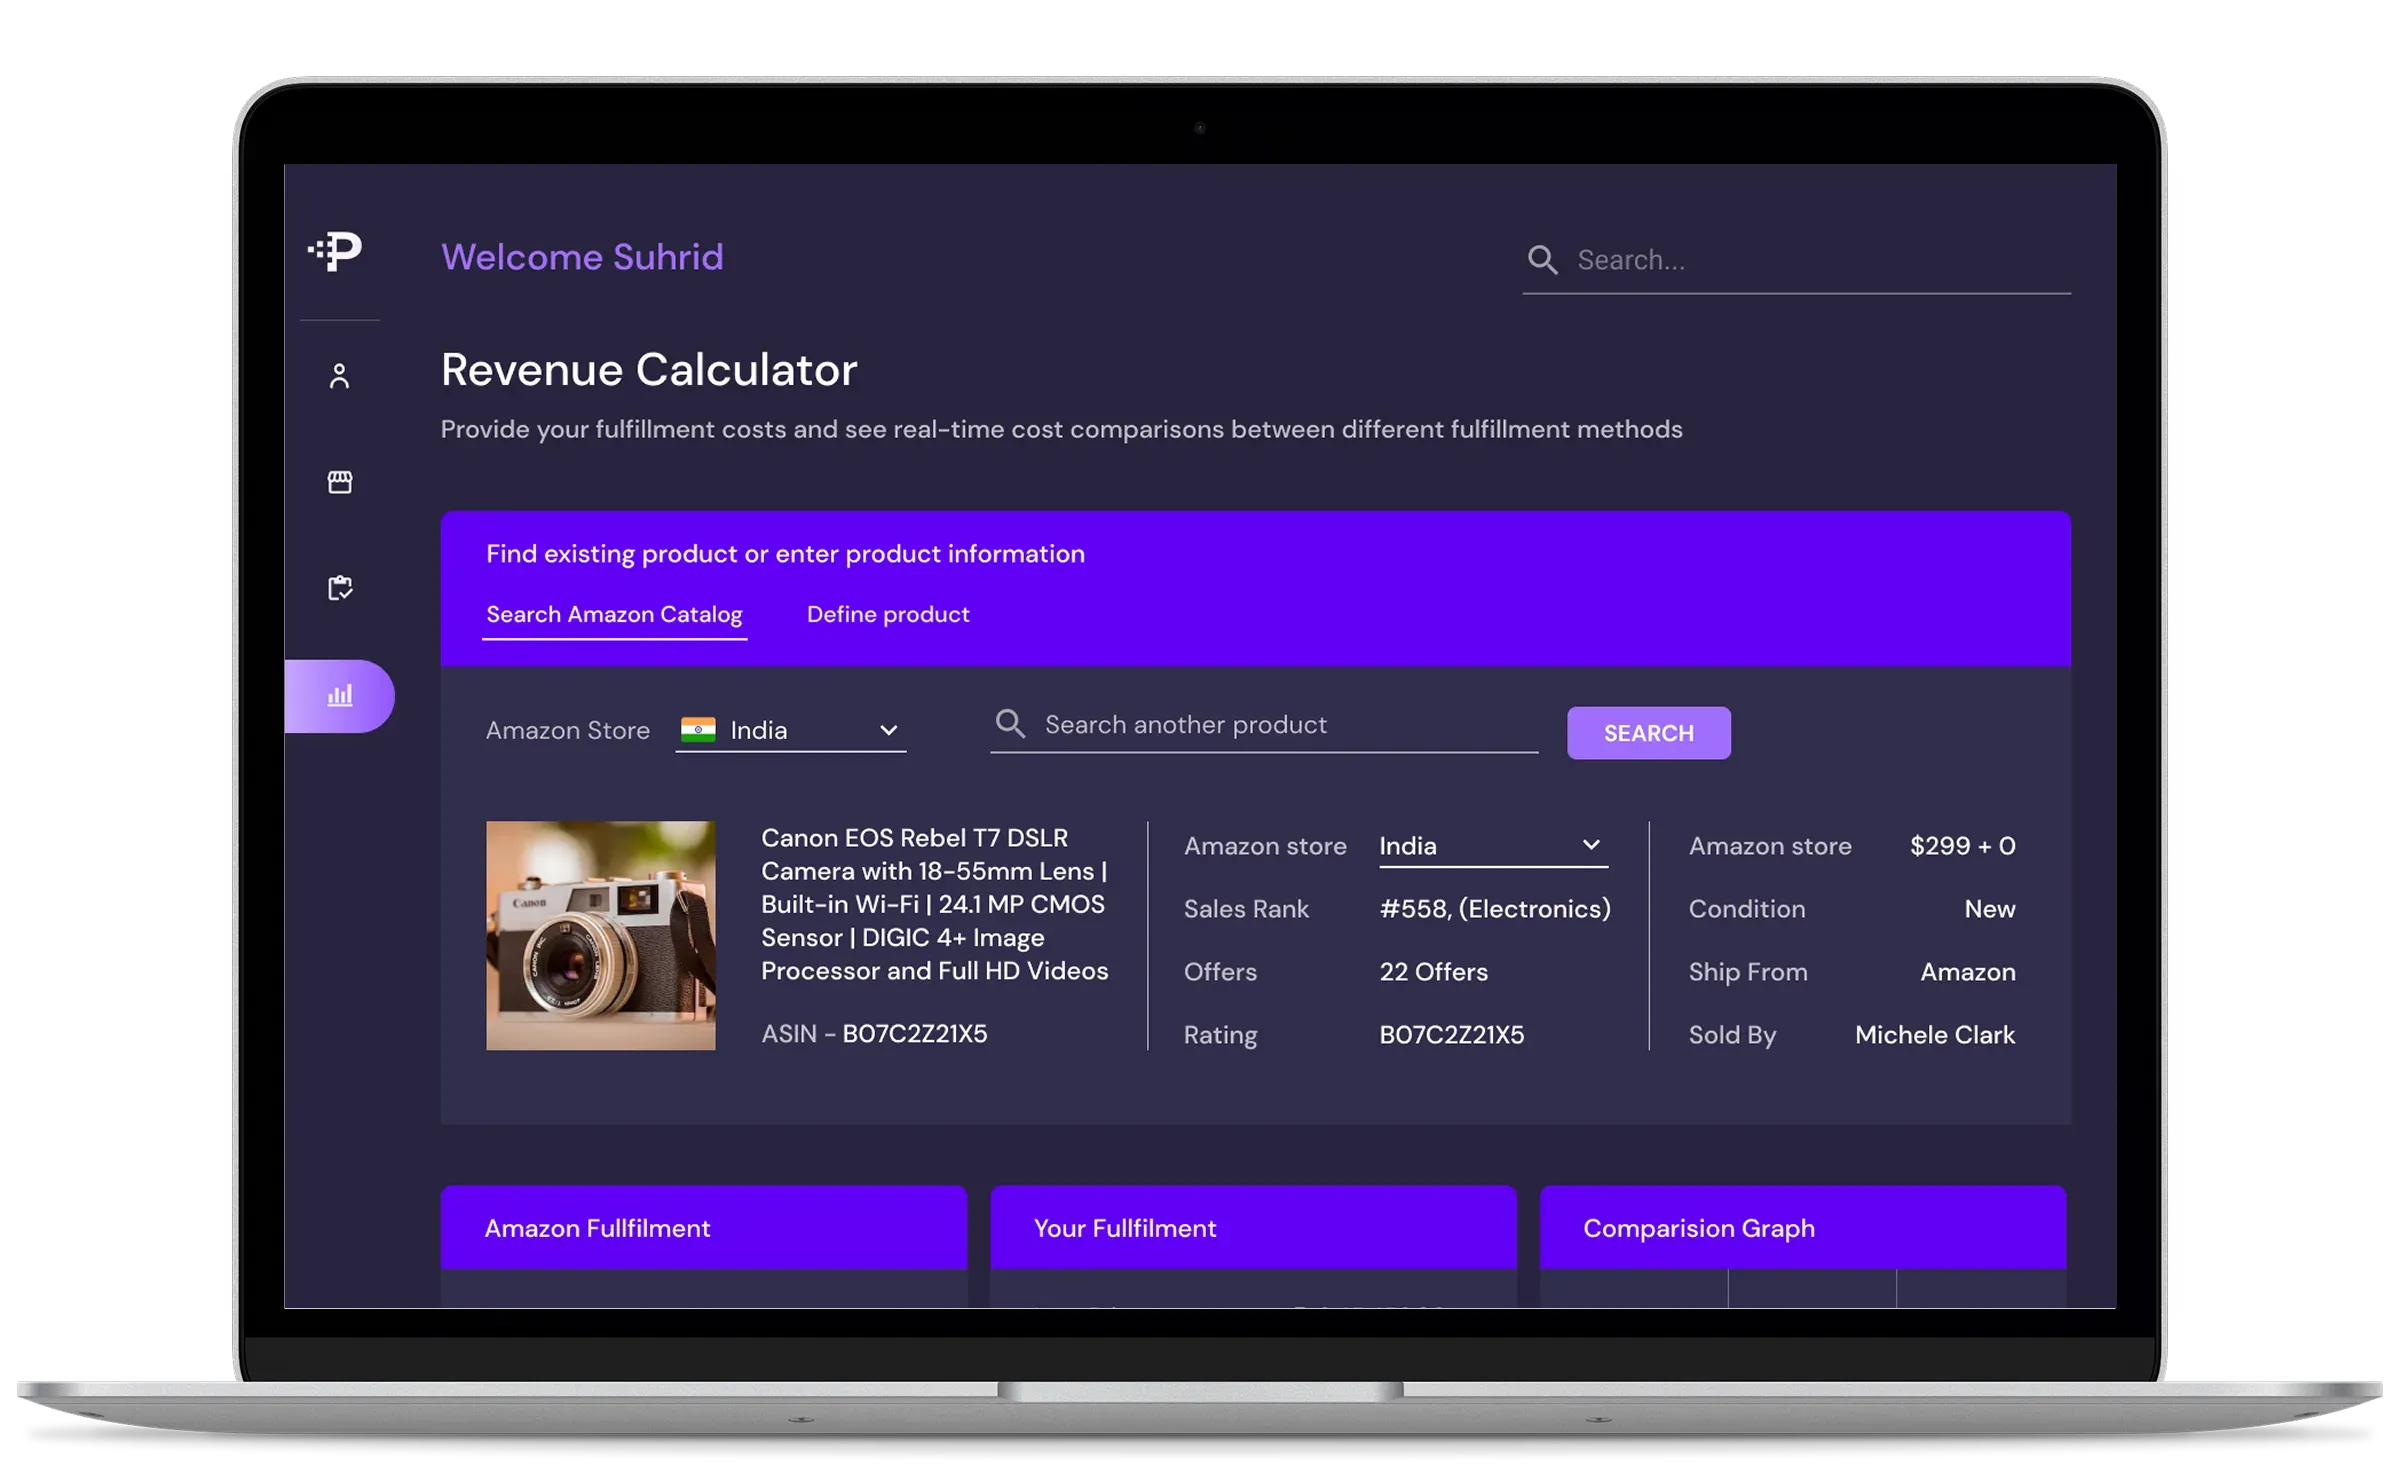
Predictive Analytics & ML Models
Forecast demand, detect anomalies, predict churn, and identify growth opportunities using machine learning trained on your historical data.
Data Strategy & Audit
Assess your current data maturity, identify gaps, and create a roadmap to become data-driven. We evaluate your tools, processes, and data quality.
Custom Analytics Applications
Purpose-built analytics tools when off-the-shelf dashboards aren't enough. Embedded analytics, customer-facing data products, and industry-specific reporting.
Data Governance & Quality
Implement data quality monitoring, access controls, lineage tracking, and compliance frameworks. Ensure your data is accurate, secure, and trustworthy.
Technology Stack


Our Work
Built demand forecasting, dynamic pricing and the QueryAI analytics bot for D2C brands
-30%
Stockouts across brands
+25%
Pricing accuracy
50%
Faster data-to-insight pipeline
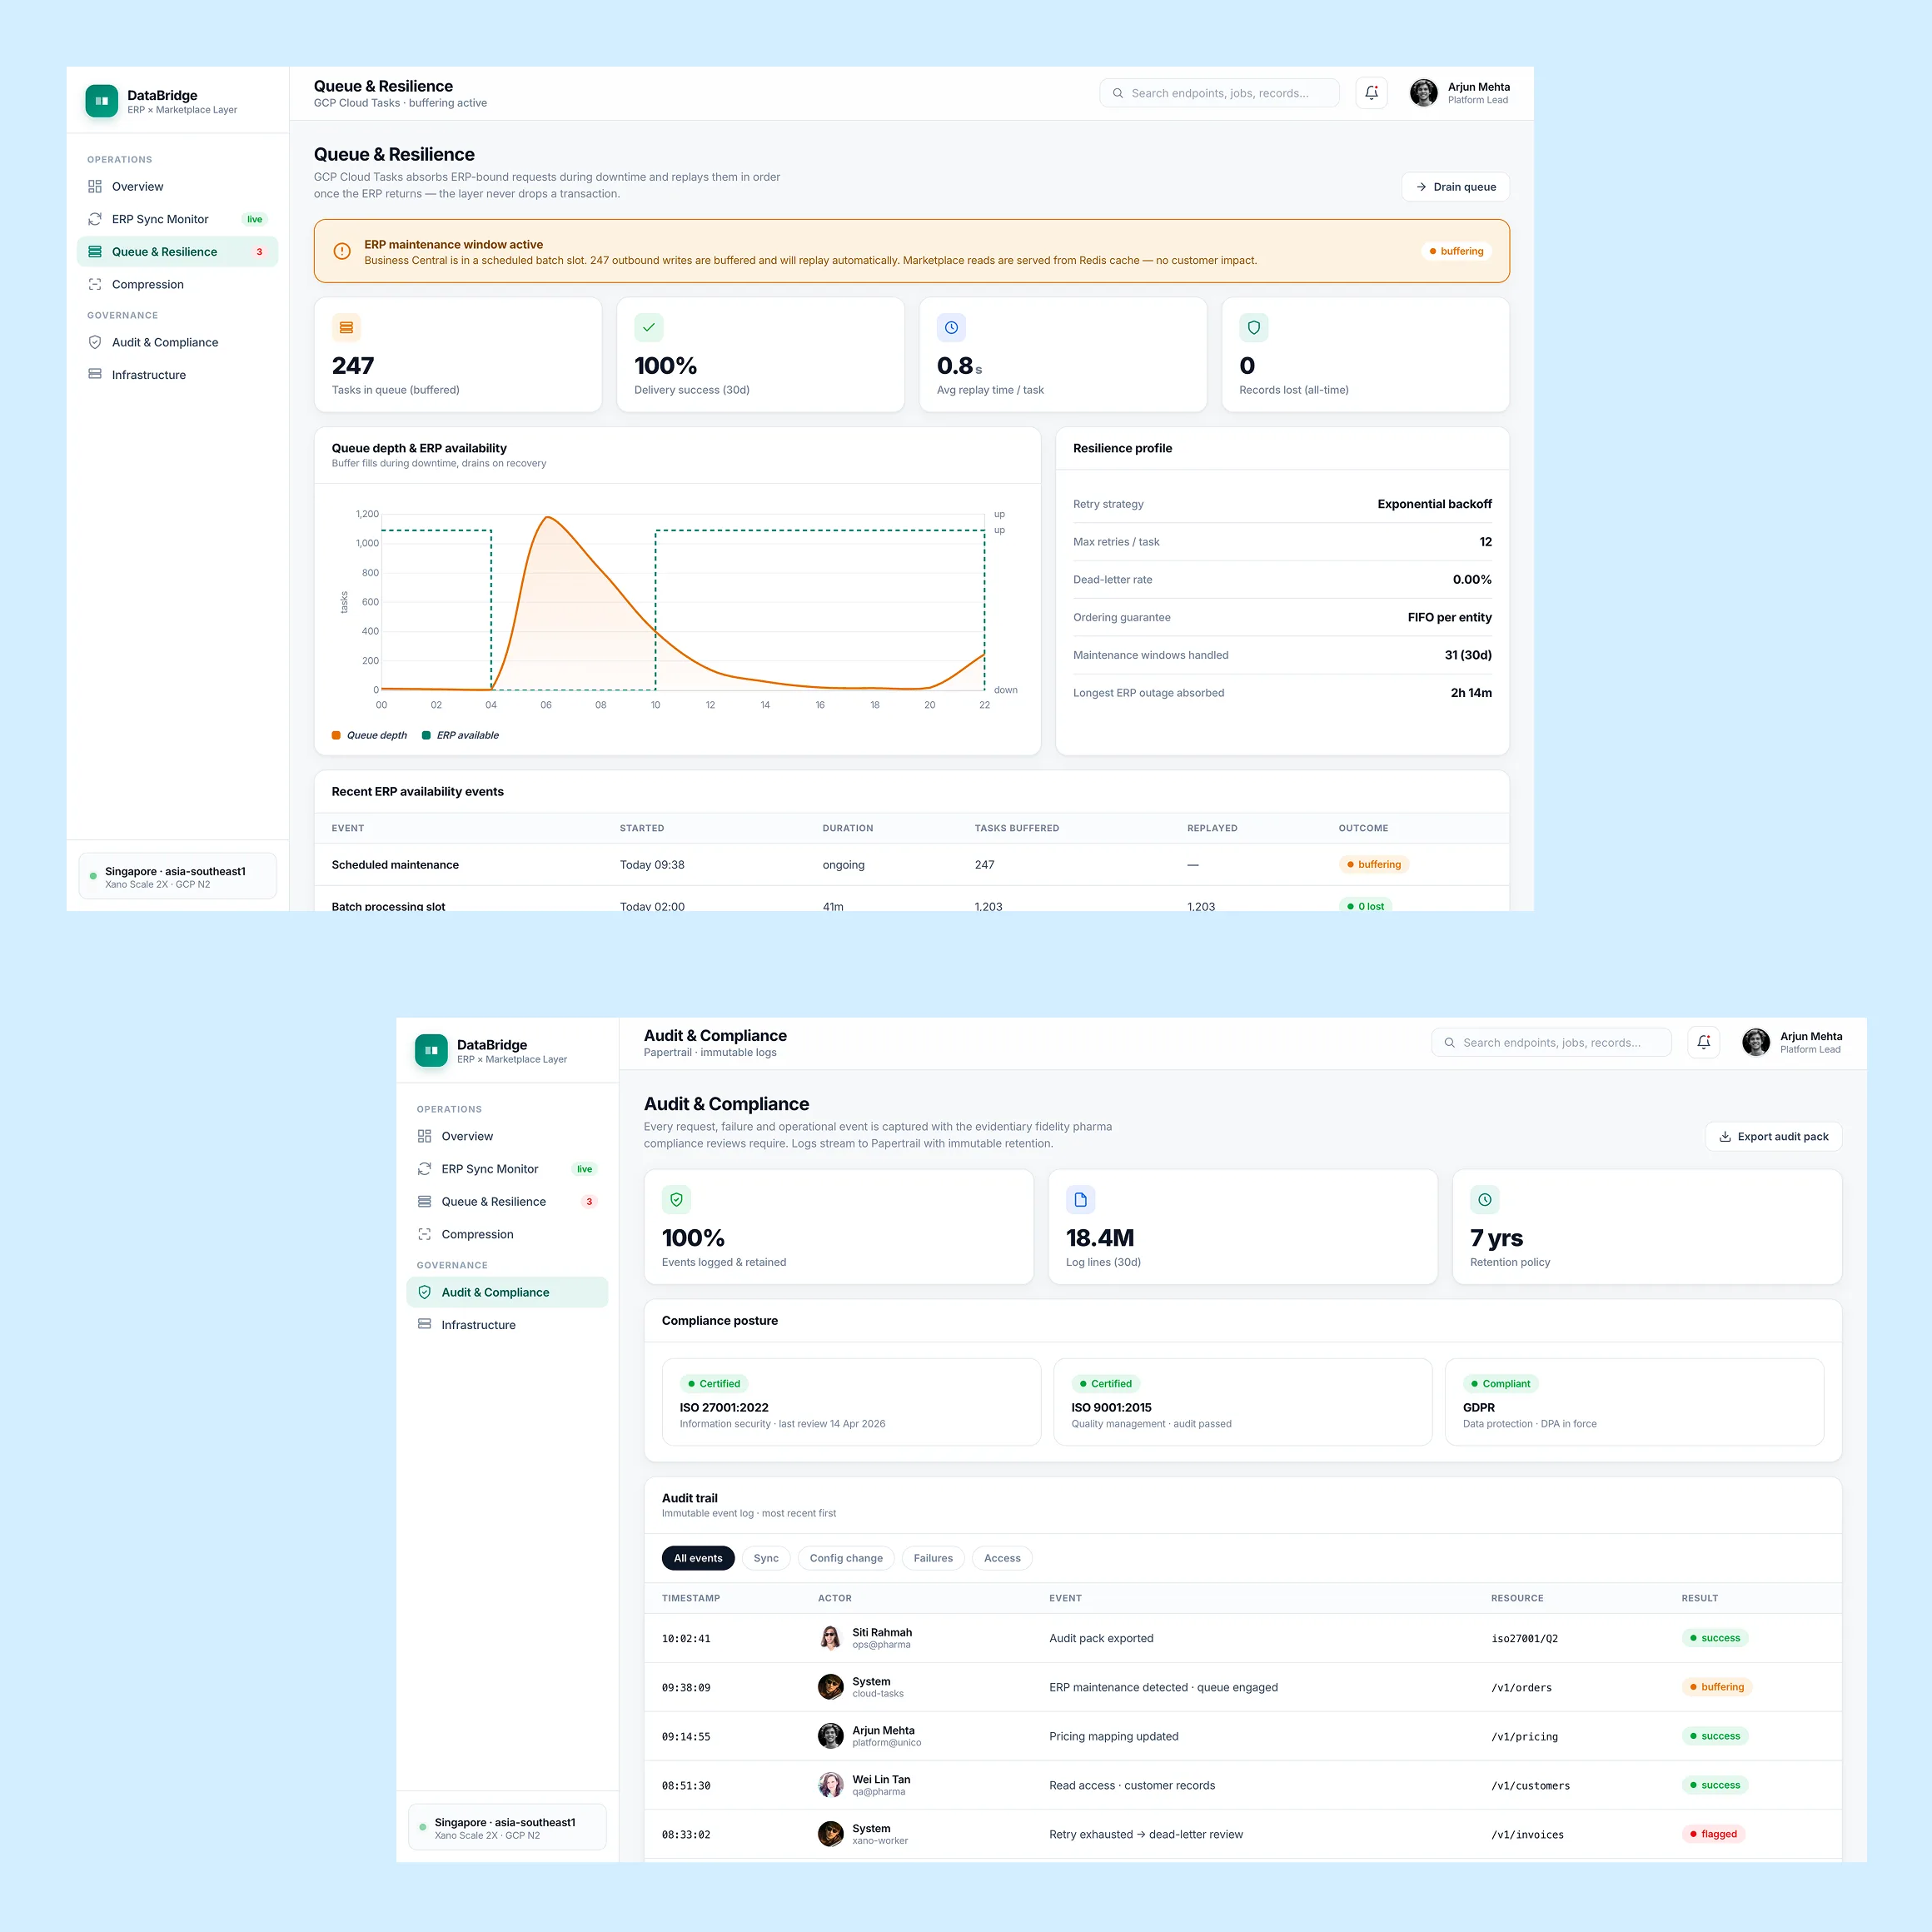
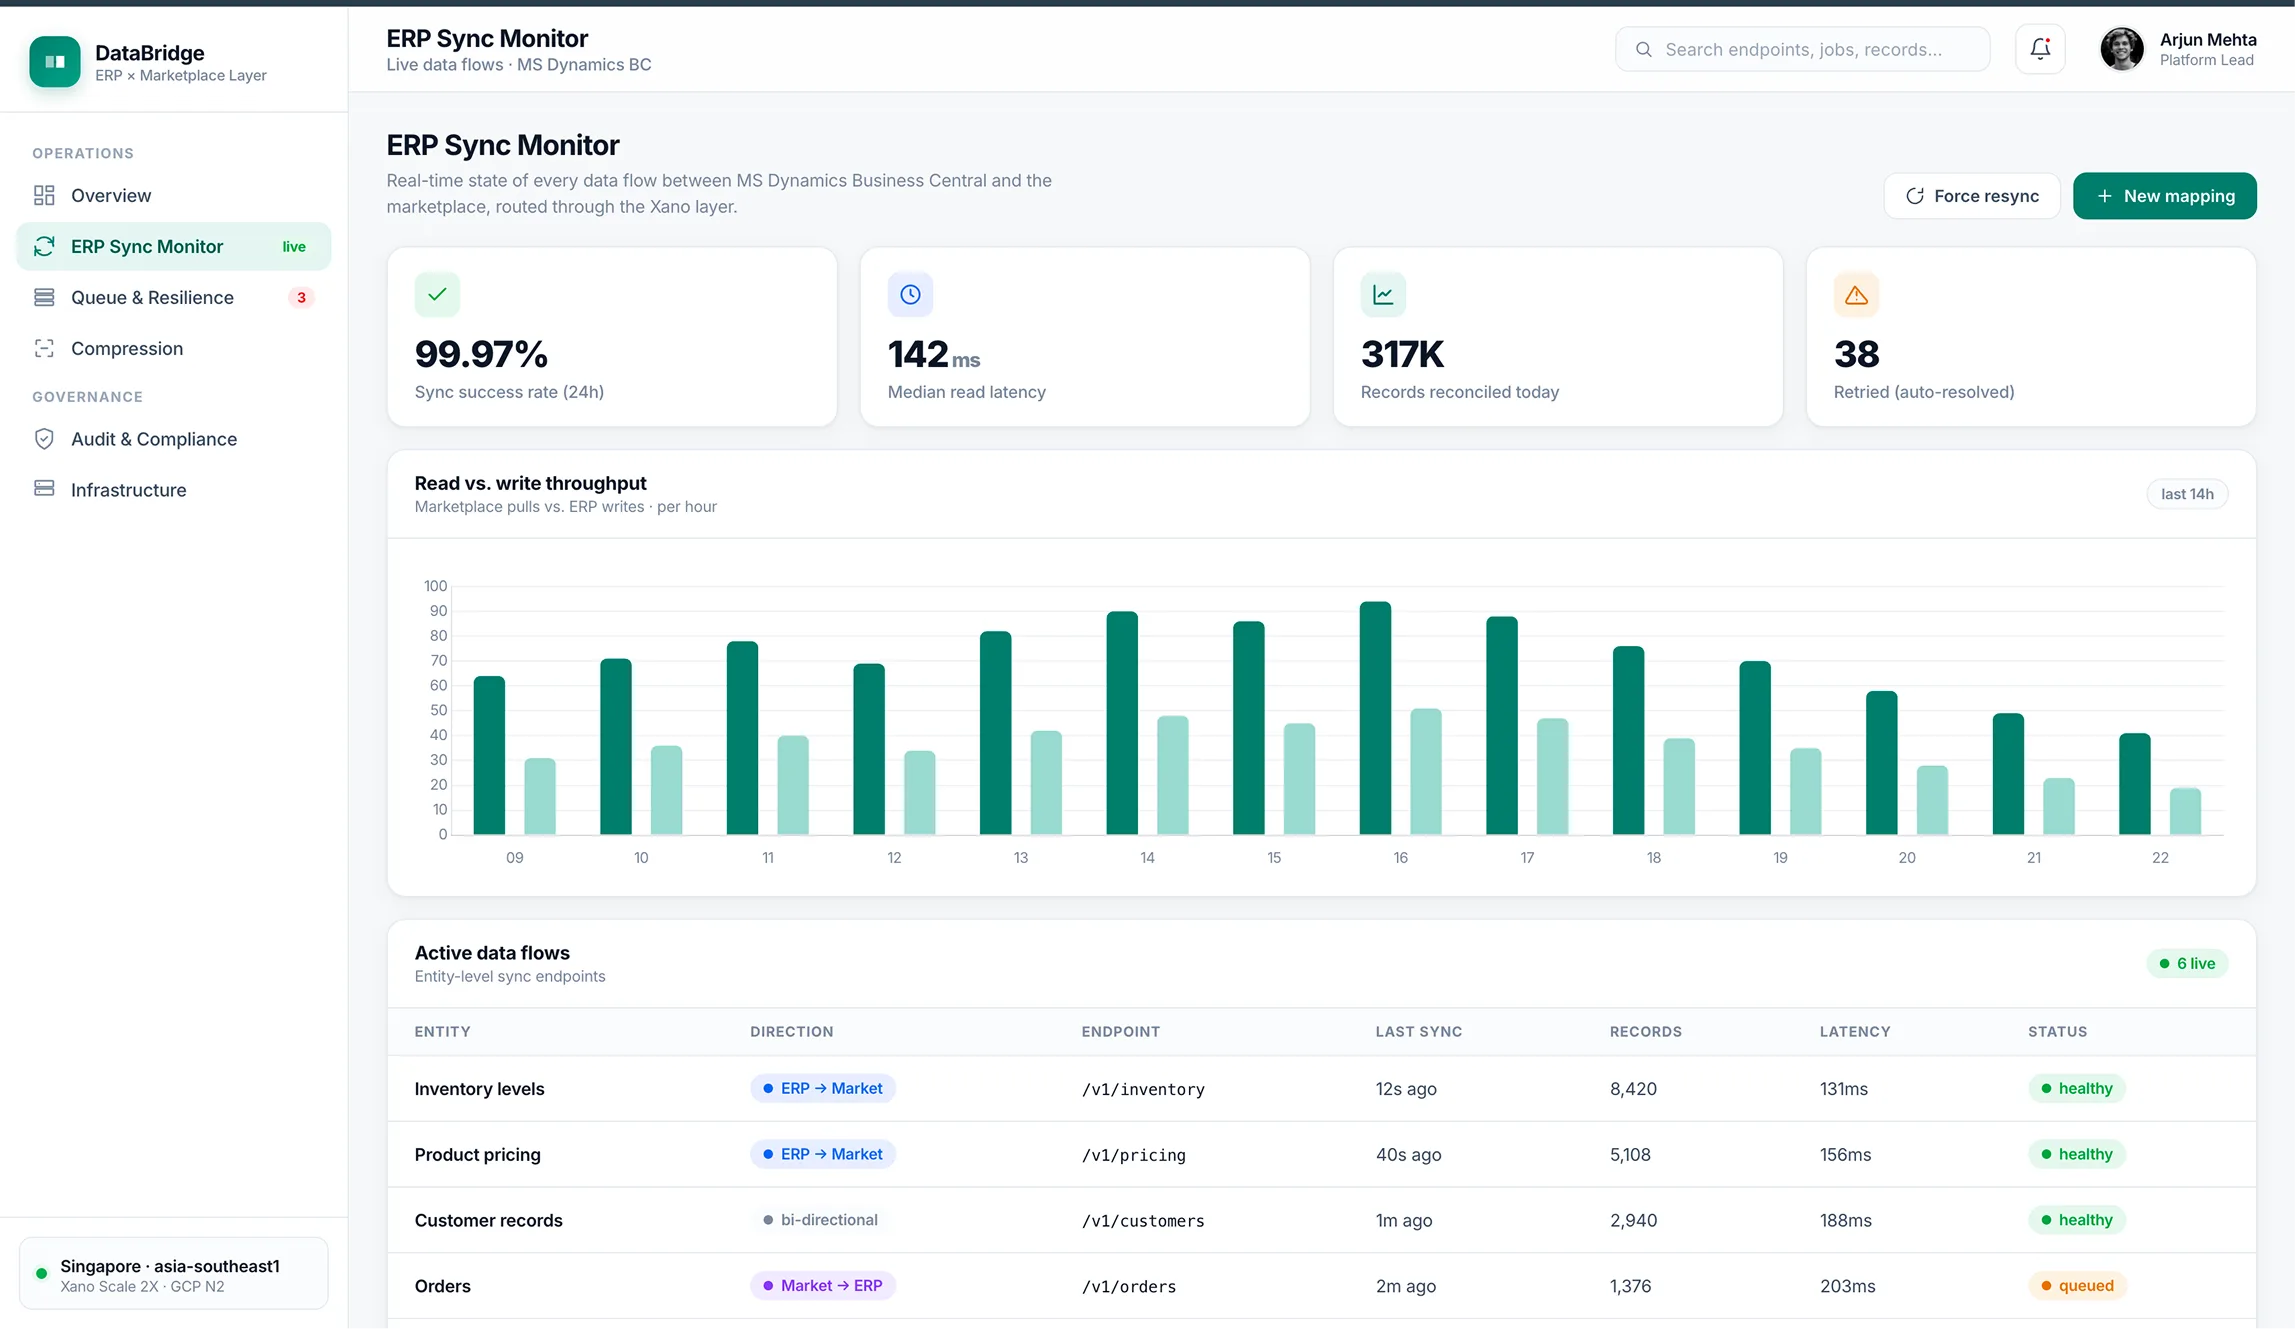
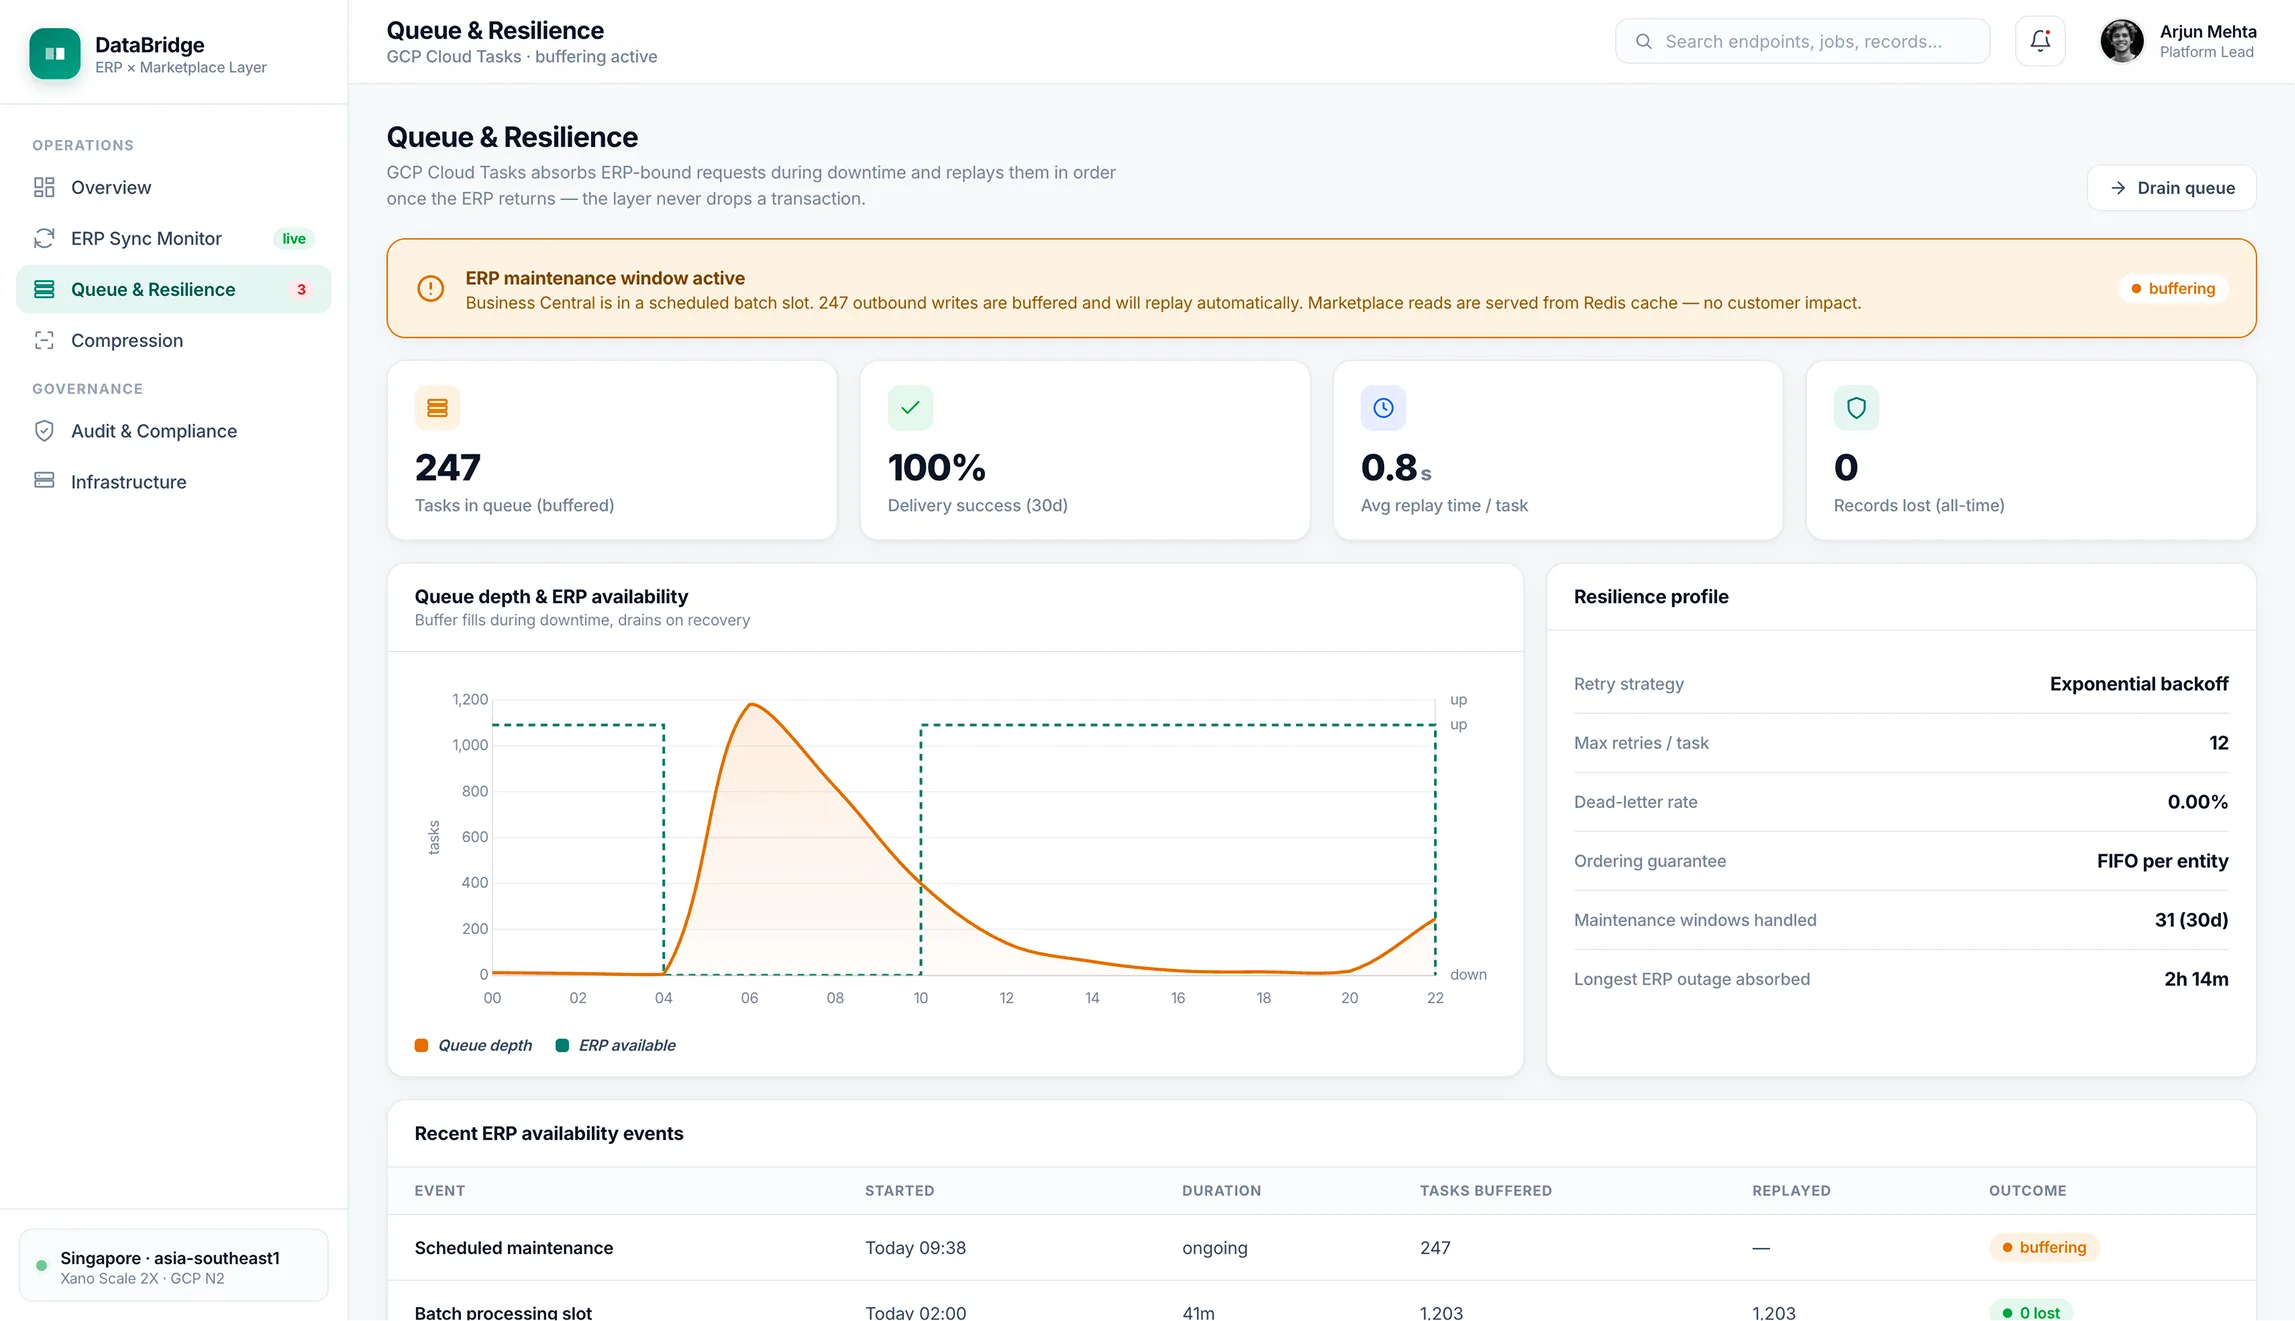
Built the enterprise data layer connecting an ERP to an e-commerce marketplace
ERP ↔ Market
Live integration backbone
Queue-backed
Resilient to ERP downtime
Singapore
Region deployment (Xano + GCP)
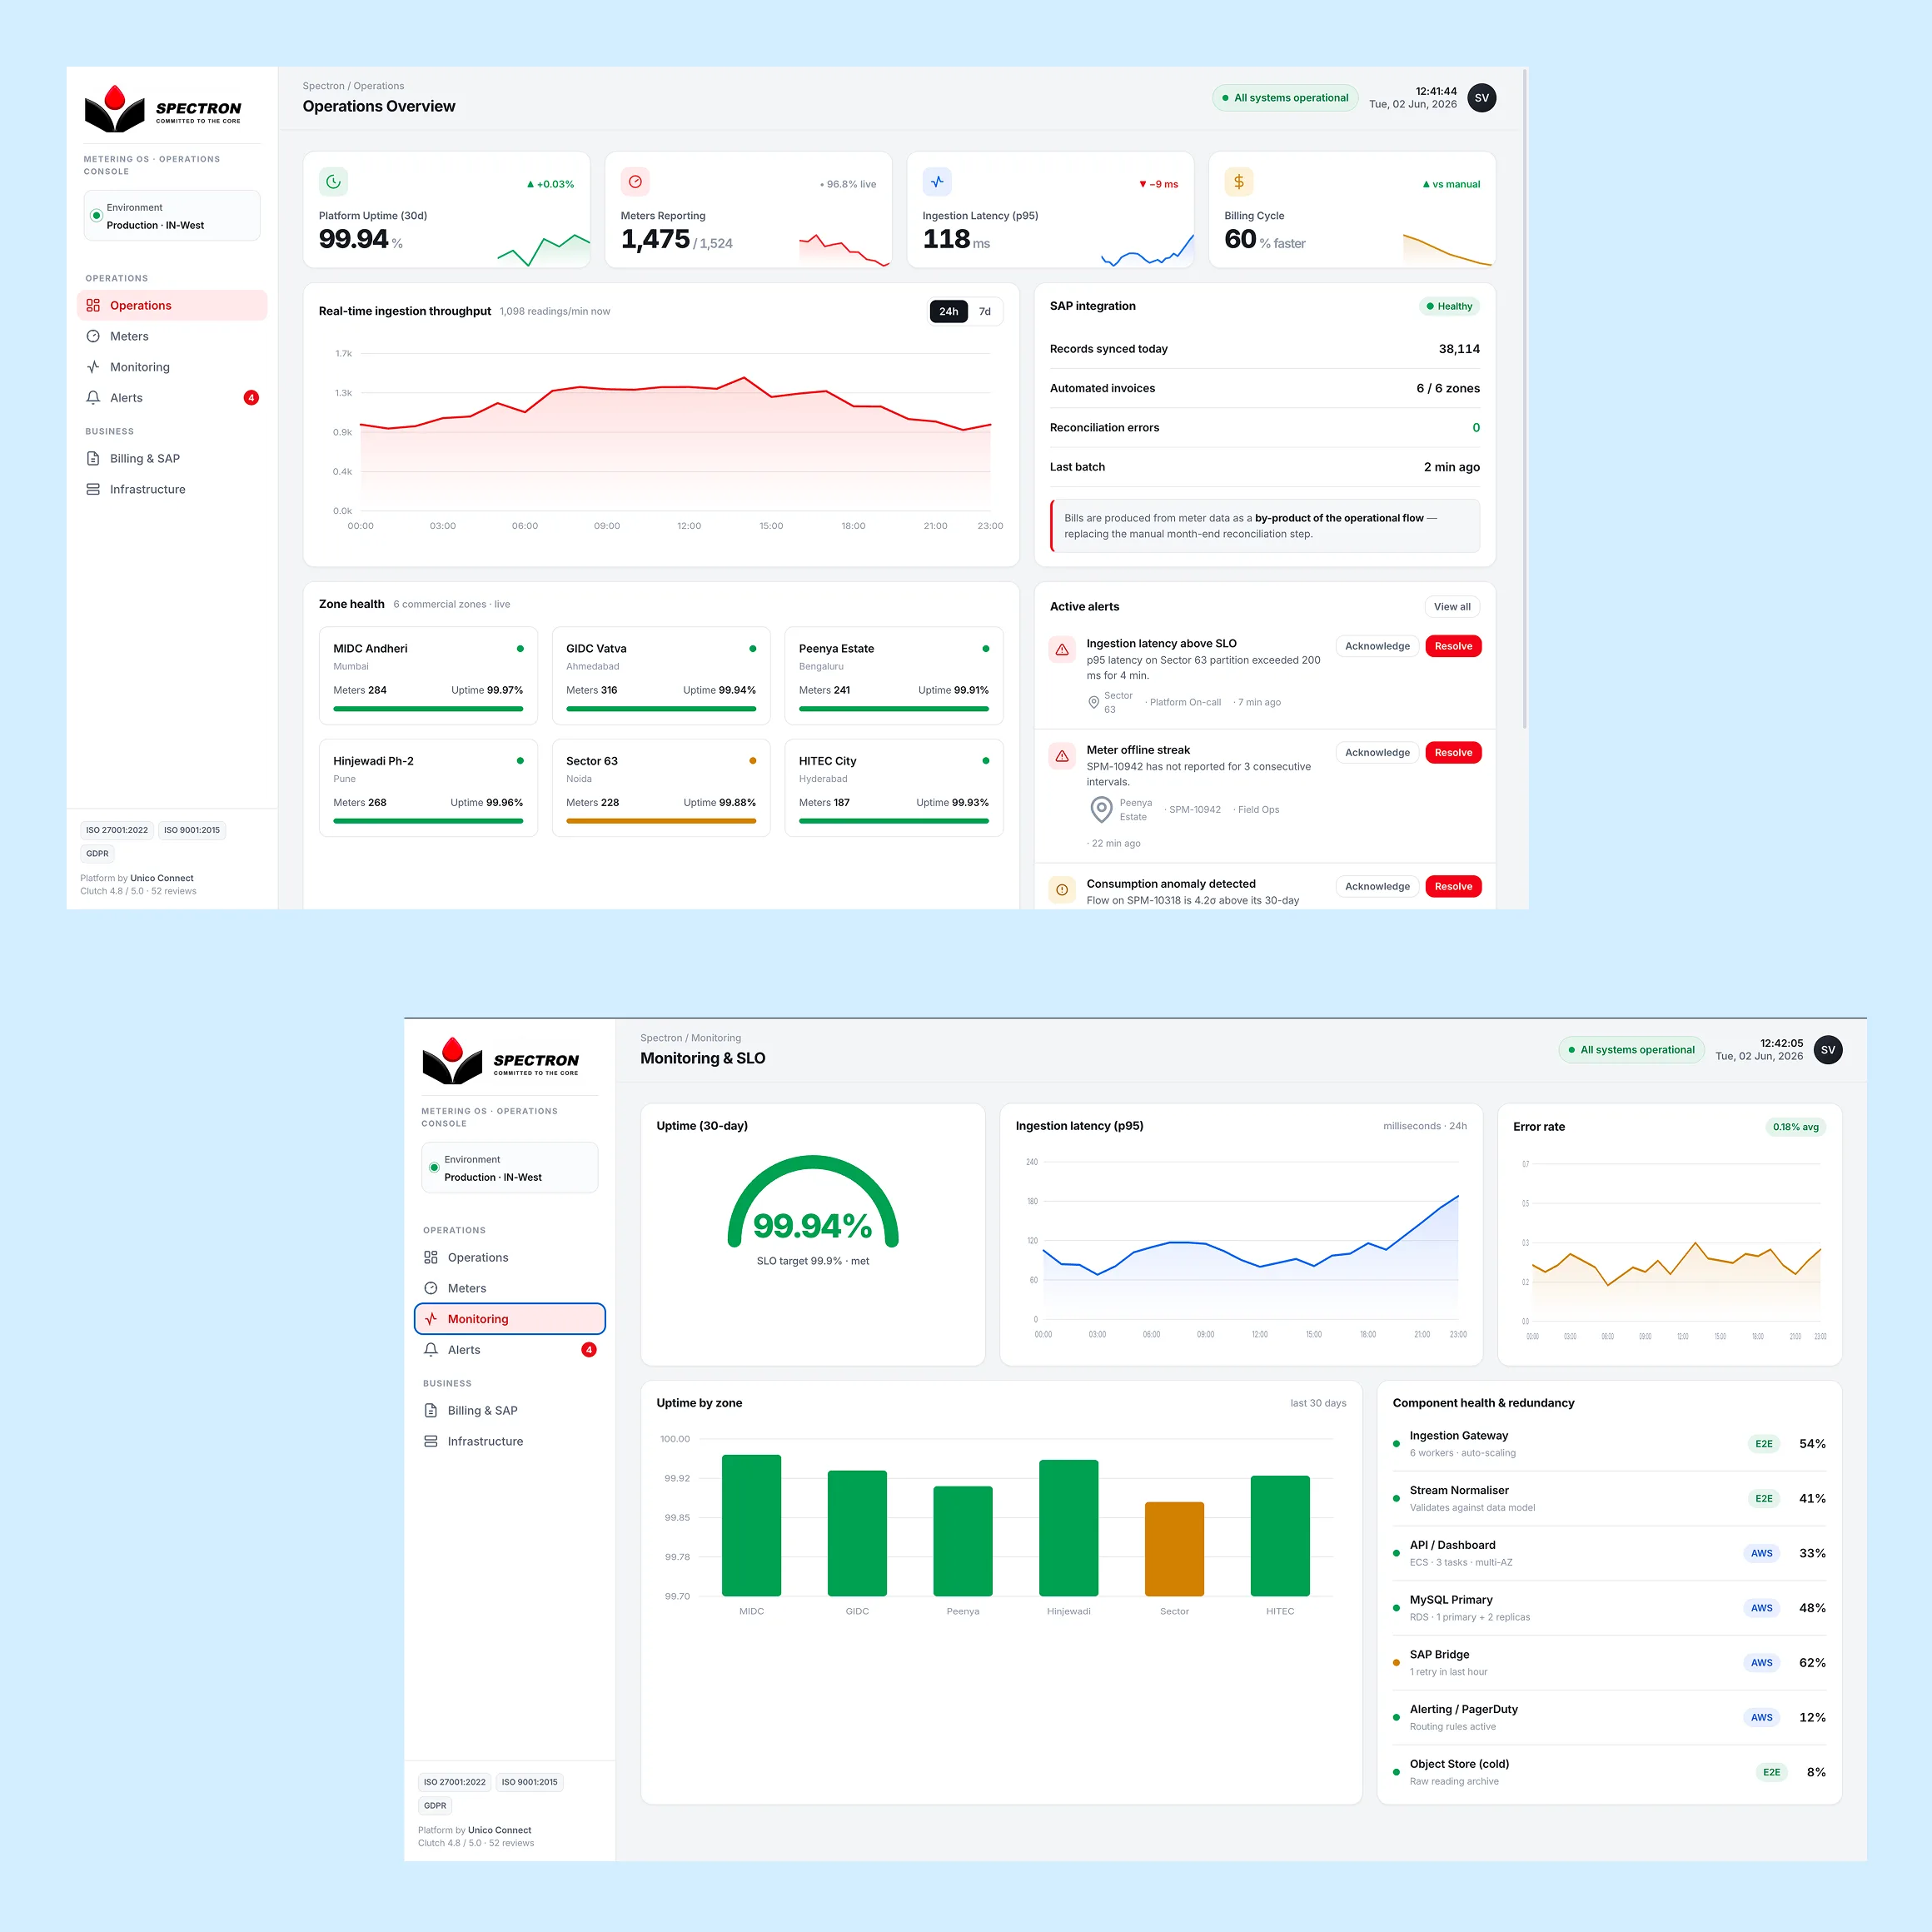
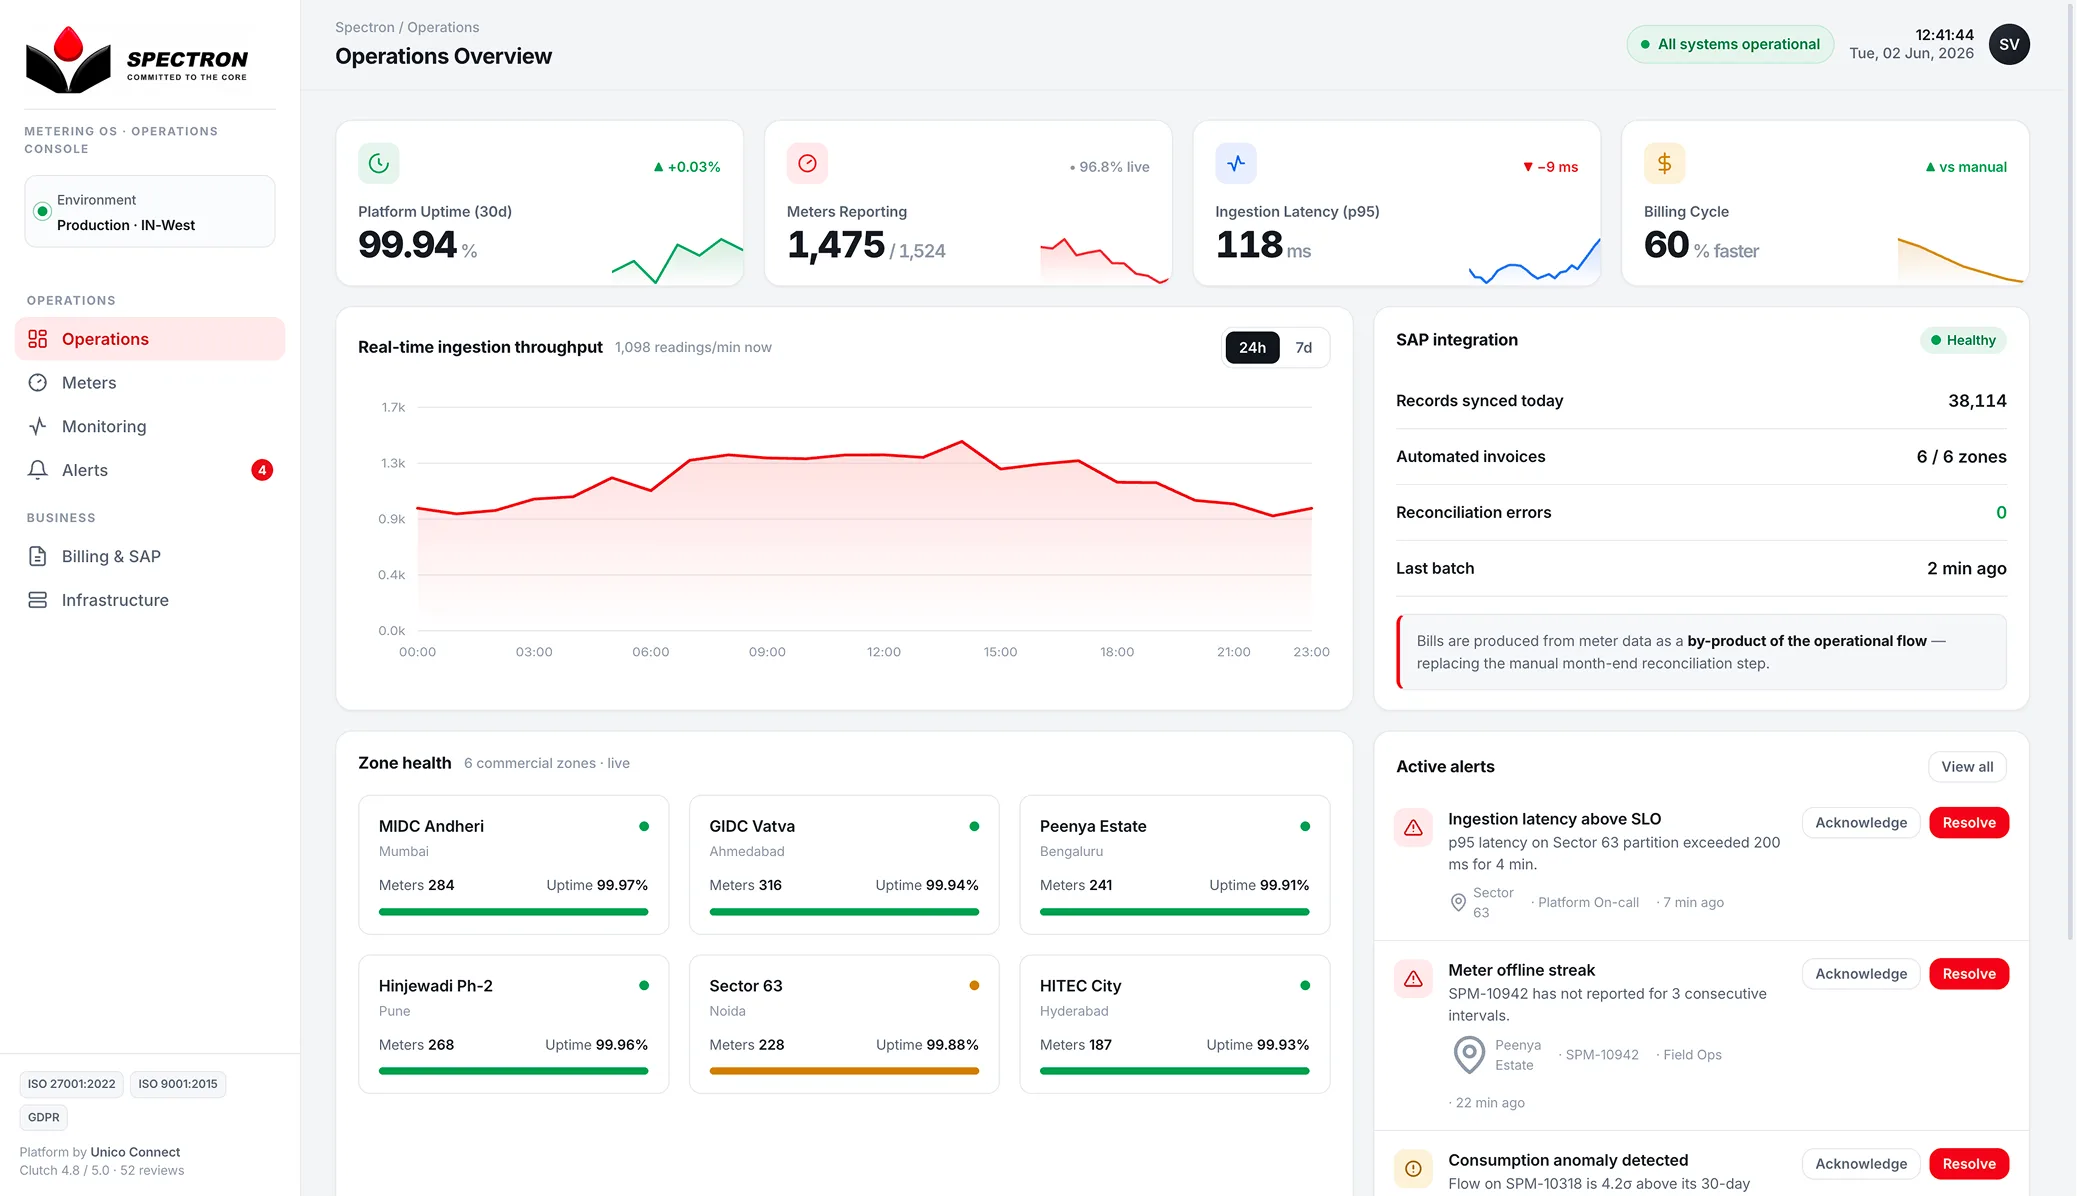
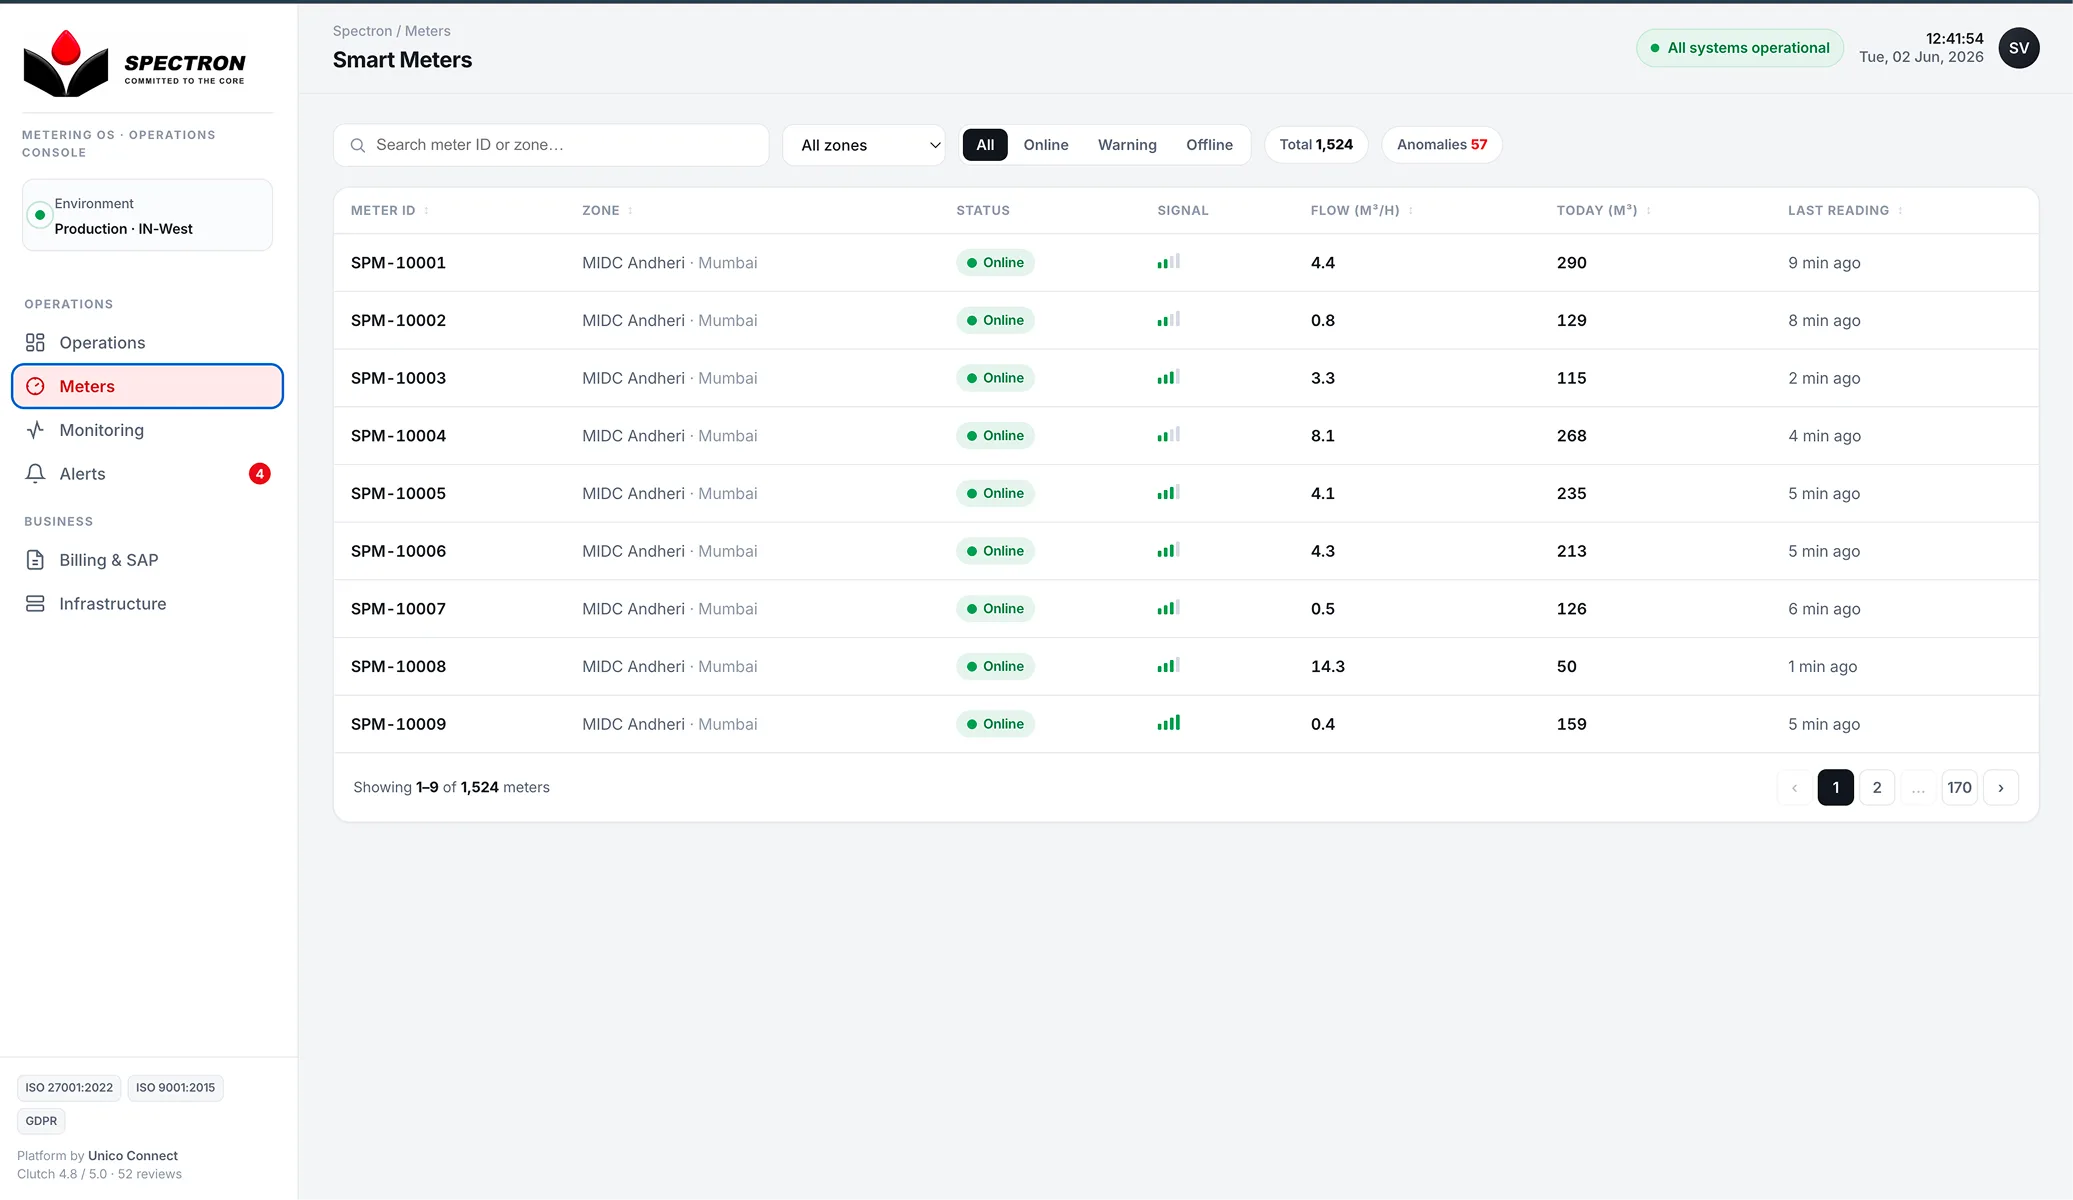
Built cloud-native smart metering infrastructure with SAP-integrated automated billing
99.9%
Platform uptime
1,500+
Smart meters monitored
60%
Faster billing cycle
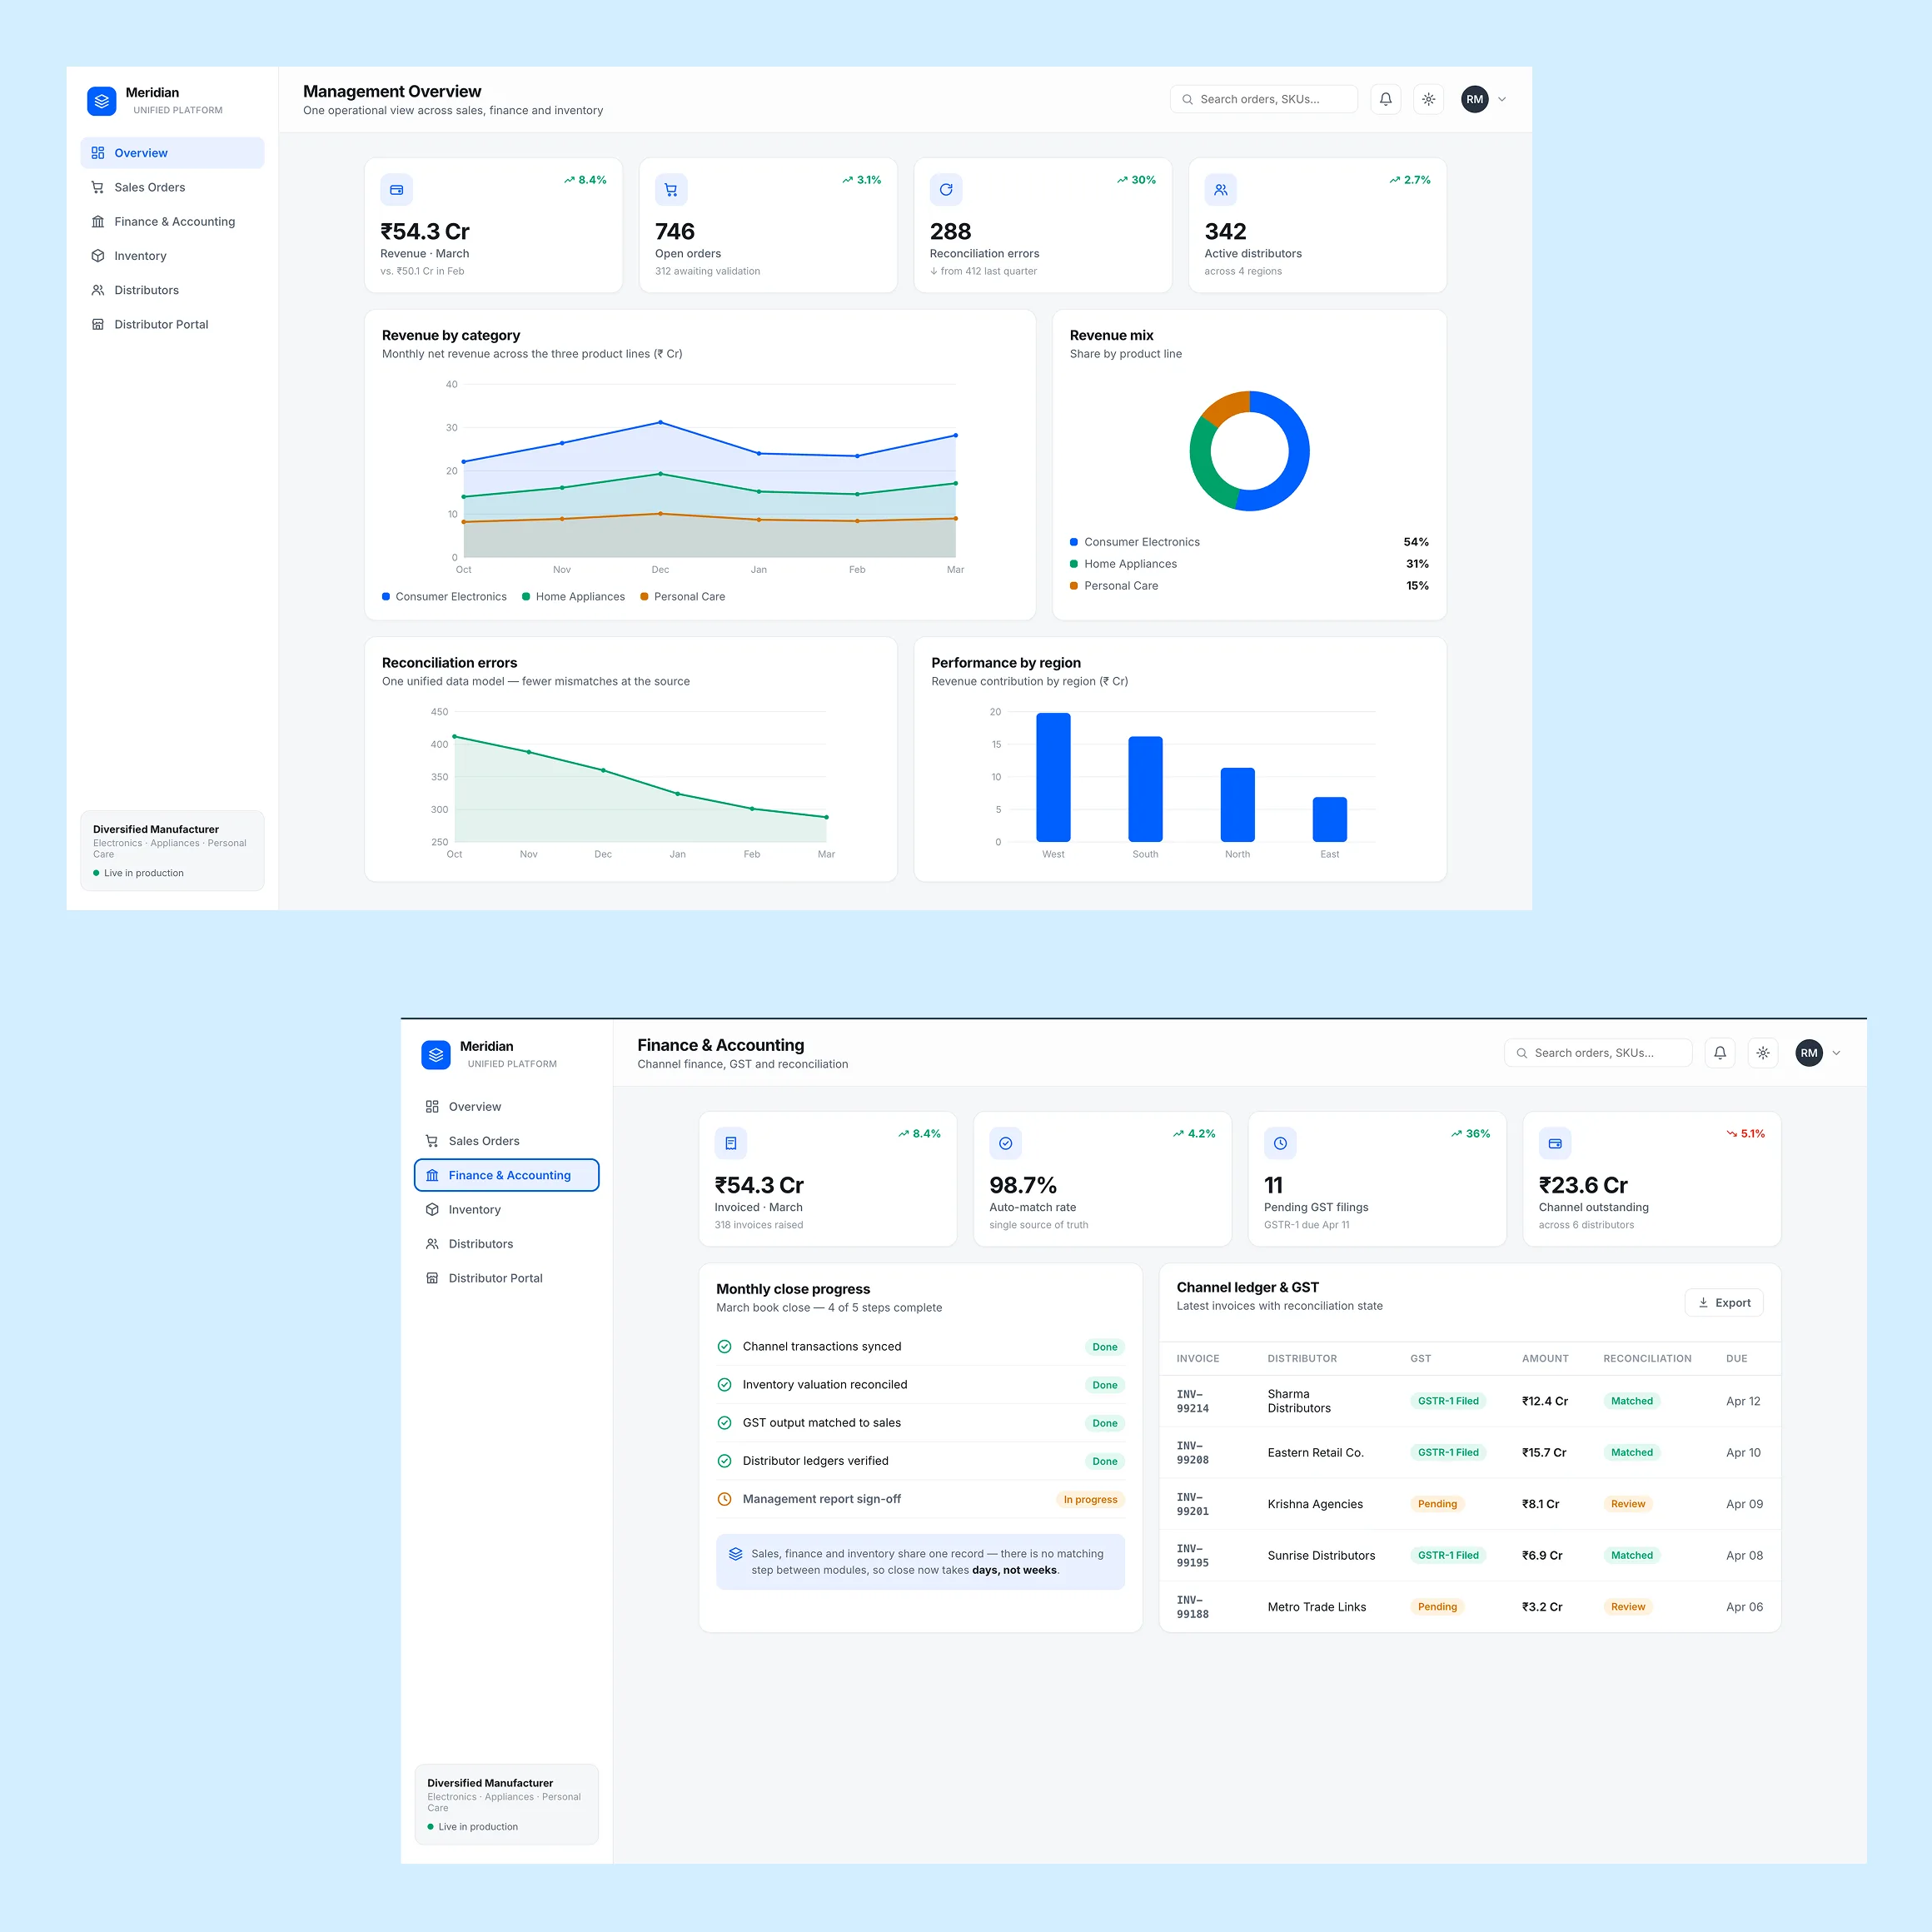
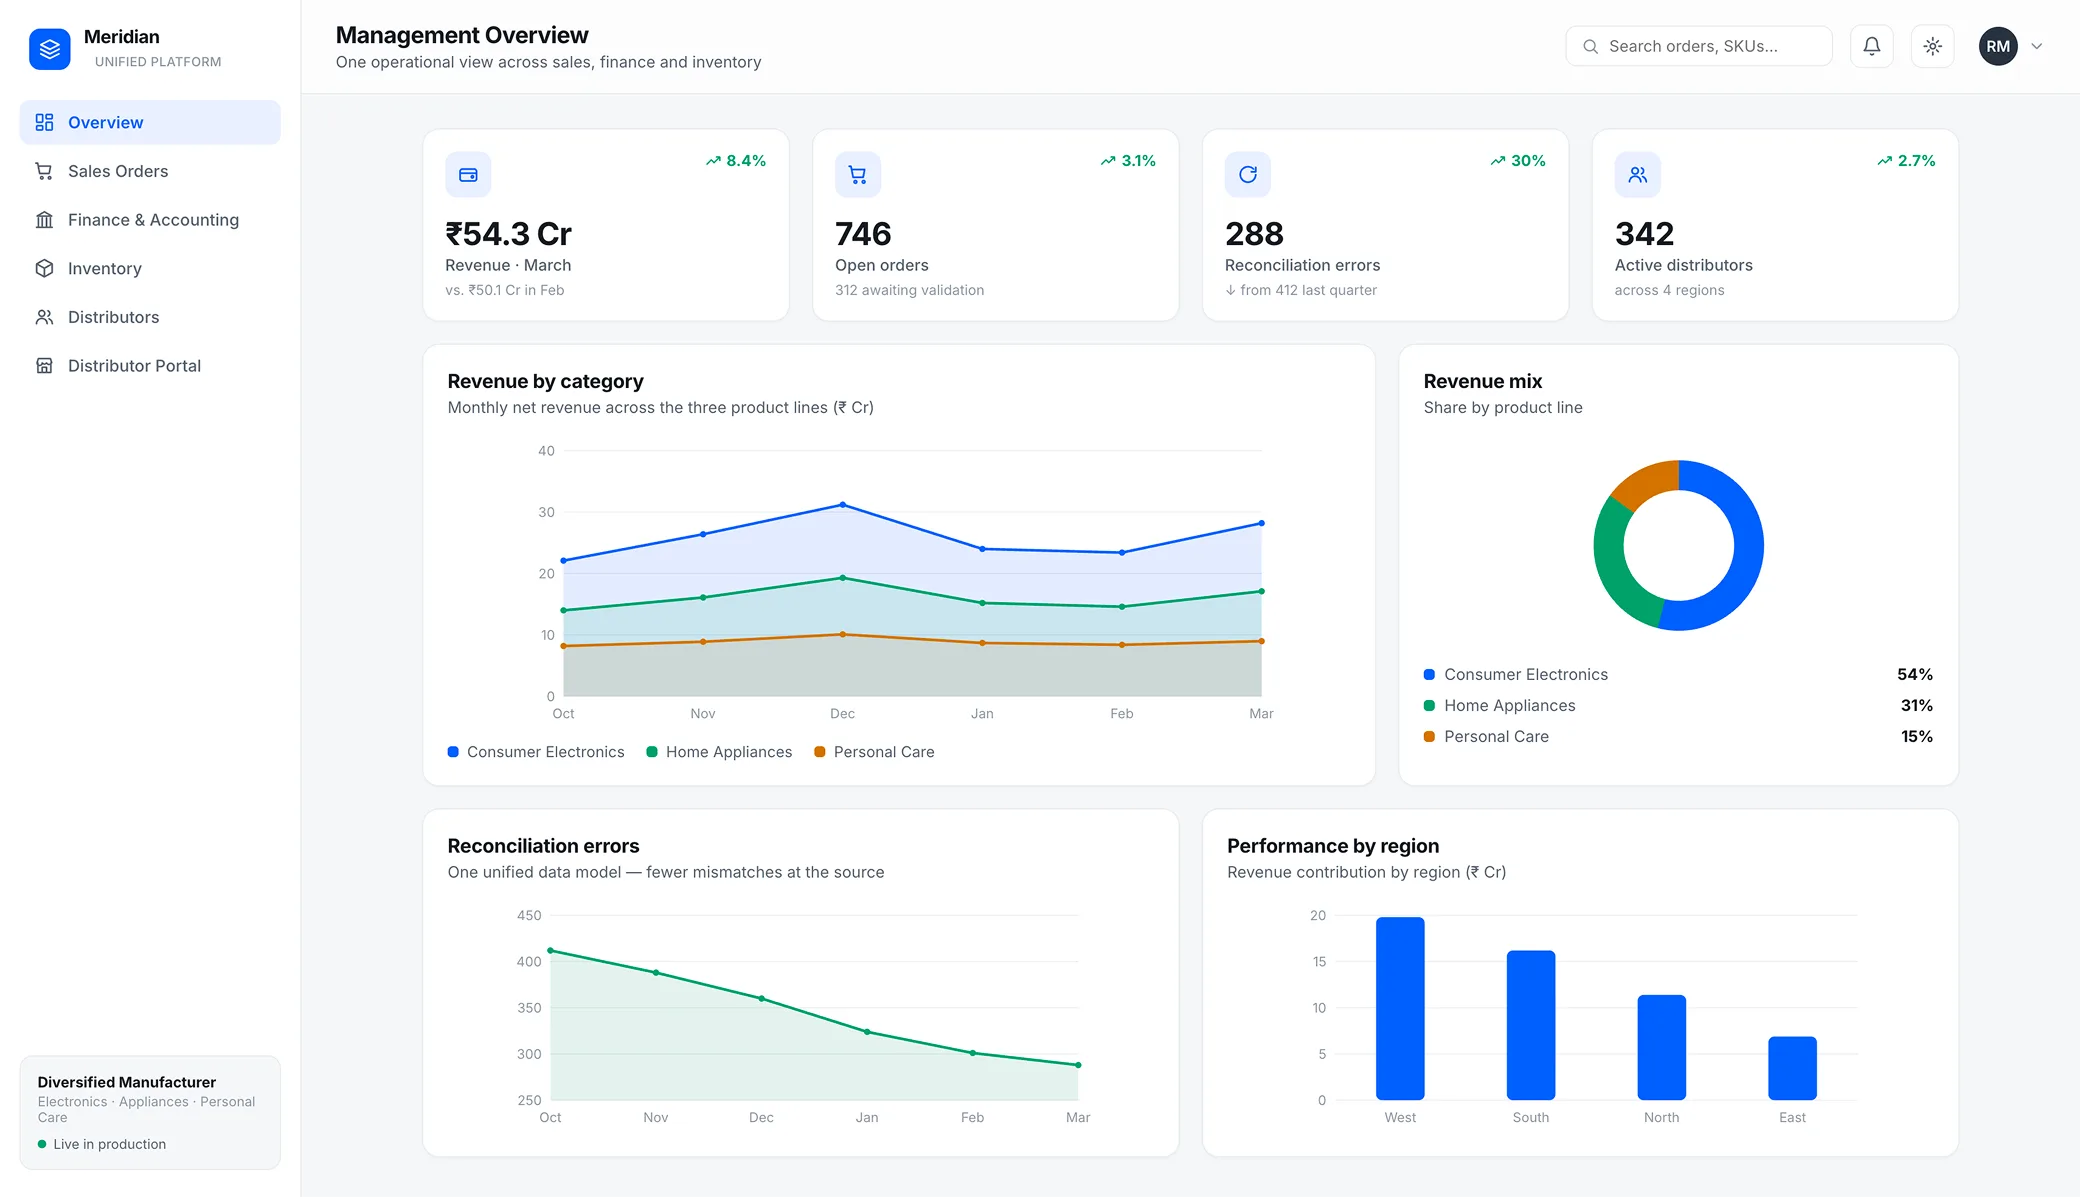
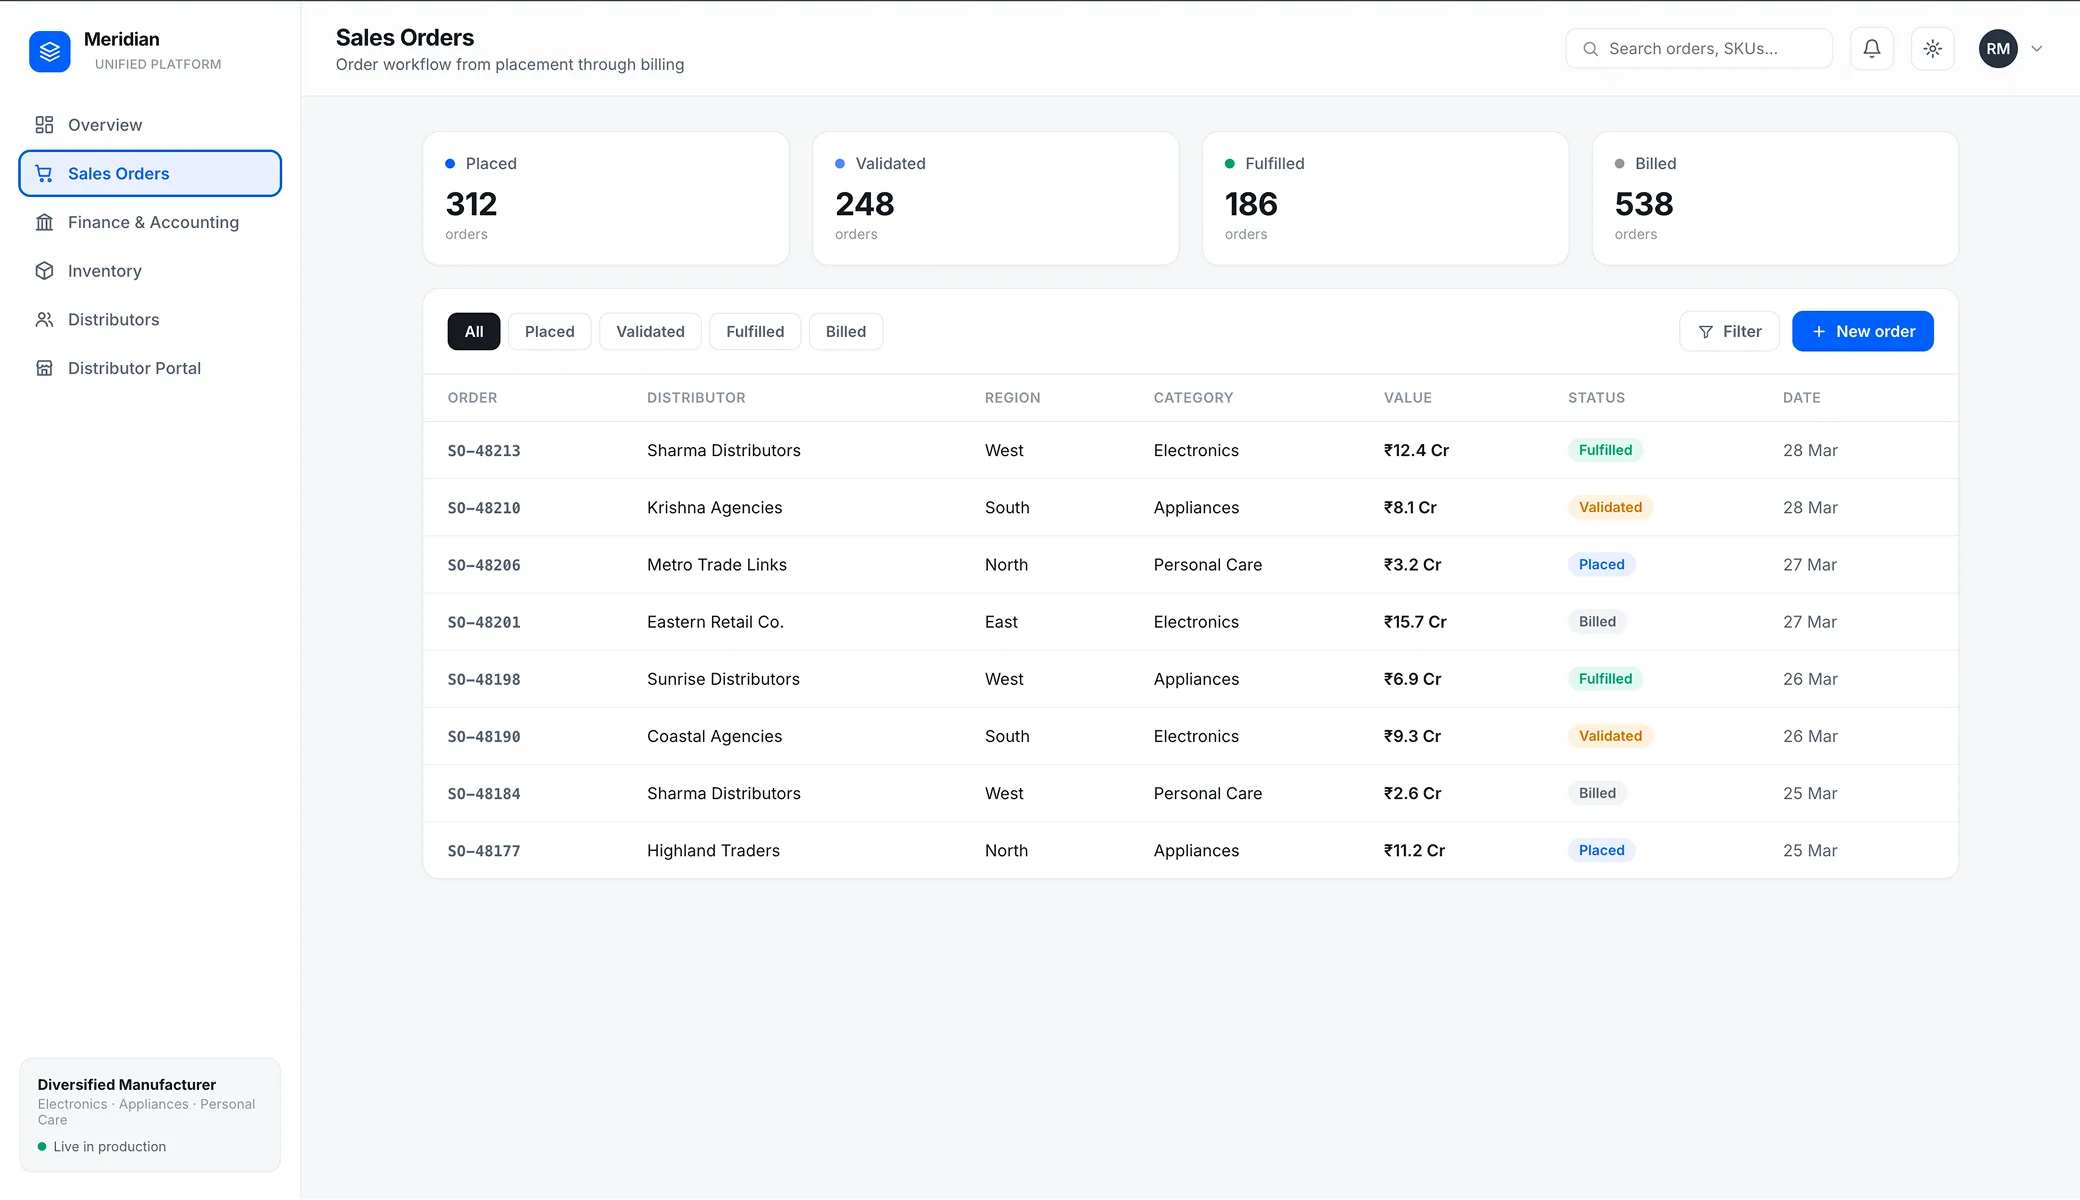
Unified sales, finance and inventory on one platform with a distributor portal
30%
Fewer reconciliation errors
Unified
Sales, finance & inventory
Self-service
Distributor order processing

Your data is piling up. We can help you turn it into decisions.
Talk to an ExpertCommon Questions About Data Analytics and Data Science
We offer descriptive, diagnostic, predictive, and prescriptive analytics. This includes dashboard development, data pipeline automation, ML model building, and data strategy consulting.
Data & Analytics Insights
View all blogs Engineering
August 18, 2025
Business Intelligence Dashboards: From Data to Action
Read More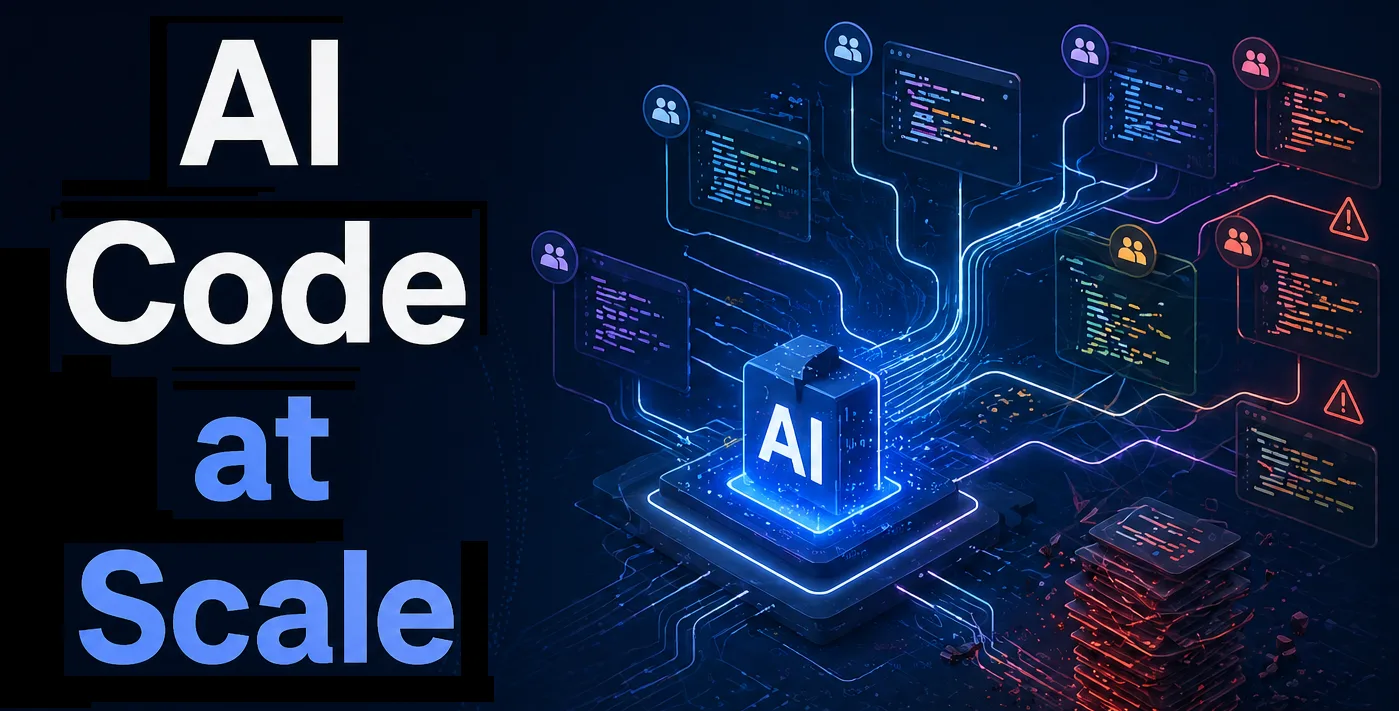 AI Development
June 3, 2026
AI Code at Scale: Patterns, Inconsistencies & Maintainability Challenges
Read More AI Development
April 27, 2026
Flutter Apps with AI: Architecture, Cost, and Lessons from Adding LLM Features
Read More
Let's Build The Next Big Thing
Fill in the form or schedule a meeting to map out a path to success.
Prefer to book directly?
🗓️ Schedule on Calendly →Or email us:
✉️sales@unicoconnect.com