









CI/CD for AI Applications, What Changes in 2026

Saurav Jagdale
Technical Lead, Unico Connect
In this article
- Quick Answer
- Key Takeaways
- Why Traditional CI/CD Breaks for AI Applications
- Layer 1: Replace Unit Tests With Evaluation Pipelines
- Layer 2: Version Prompts and Models as First-Class Artifacts
- Layer 3: AI-Native Monitoring Goes Beyond Uptime
- Layer 4: Canary Rollouts for Behavioural Changes
- The Comparison: Traditional vs. AI-Native CI/CD
- EU AI Act Compliance and Audit Logging
- What We Use in Practice
- Frequently Asked Questions
Quick Answer
Traditional CI/CD pipelines assume deterministic code, where the same input always produces the same output. AI agents do not work that way. When the system you deploy is an AI agent, you need to rethink testing (from unit tests to LLM evaluations), monitoring (from uptime to behavioural drift), versioning (prompts and models alongside code) and deployment strategy (canary rollouts that catch behavioural regressions as well as crashes).
Key Takeaways
- Unit tests only validate the scaffolding code, so add a separate evaluation layer that scores AI behaviour against golden test sets
- Give prompts and models their own versions, distinct from the application code version, and put every change to either through the same change management discipline you use for code
- In production, watch latency P95, token cost per request, hallucination rate and fallback trigger frequency, because uptime and error rates will not tell you whether the AI is still accurate
- Judge an AI canary on behavioural regressions as well as technical failures. A release can be technically healthy and still behave worse
- The EU AI Act requires automatic event logs for high risk AI systems from 2 December 2027 (Annex III uses) or 2 August 2028 (AI in Annex I products), so plan your logging architecture around it before you deploy
When we started deploying AI agents for production clients in 2024, we used the same CI/CD setup as our traditional SaaS products, with GitHub Actions for orchestration, Docker for containerisation and standard unit and integration tests. That covered the scaffolding code well enough, but the pipeline told us nothing about whether the AI was behaving correctly.
Why Traditional CI/CD Breaks for AI Applications
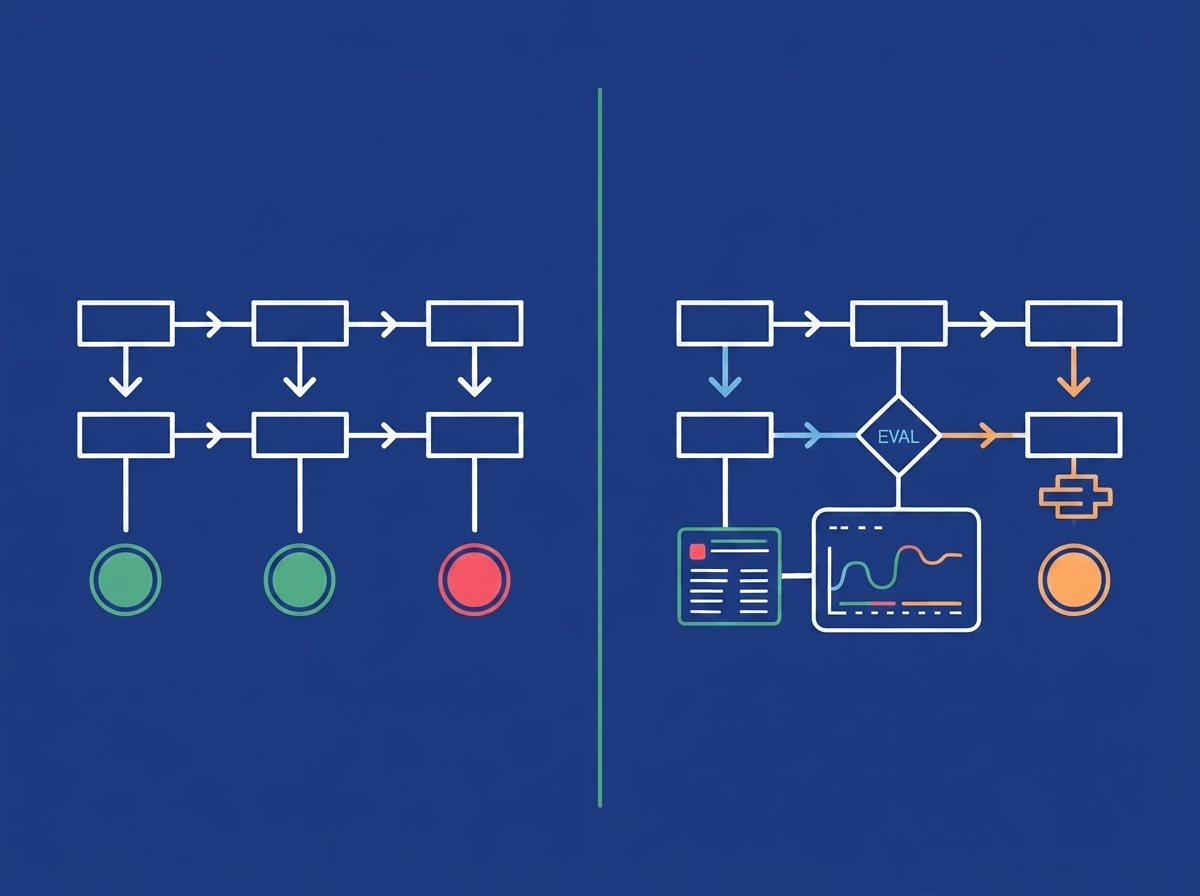
Traditional CI/CD is designed for deterministic systems, where the function always returns output Y for input X. LLM outputs are not deterministic. Your unit tests pass green while the AI is still wrong on 15% of edge cases. Versioning is the second problem, because you now have three separate things to version, namely application code, prompts and the underlying model. Monitoring is the third. Traditional APM tools track latency and error rates, and they will not tell you whether the AI is being helpful and accurate.
Layer 1: Replace Unit Tests With Evaluation Pipelines
For AI applications, split the test suite into two tiers.
Tier 1 covers the scaffolding code with deterministic tests. API routing, auth and DB operations get standard unit and integration tests, which run fast (under 2 minutes) and block deployment if any of them fail.
Tier 2 is LLM evaluation of AI behaviour. It uses a golden test set of 50-200 representative inputs, each with an expected output or acceptable output criteria, and an evaluation runner that scores every output against those criteria. Nothing deploys until the pass rate clears a minimum threshold (we use 90%). LangSmith handles the evaluation orchestration, and a golden set run typically finishes in 3-8 minutes and costs $1-5.
Layer 2: Version Prompts and Models as First-Class Artifacts
A prompt is not configuration. It is code, and current practice keeps it in version control alongside the application code. Every prompt change goes through a PR that describes the intended behavioural change, and the change triggers an evaluation run automatically. Each deployment is tagged with the application code version, the prompt version and the model version.
Layer 3: AI-Native Monitoring Goes Beyond Uptime
Technical health metrics cover API response time at P50/P95/P99, token consumption per request, error rates and resource utilisation.
Behavioural health metrics include hallucination rate (scored by LLM-as-judge on sampled production traffic), fallback trigger rate, task completion rate, confidence score distribution and semantic drift. We track the behavioural metrics in Grafana, and LangSmith captures the full LLM traces. Alerts fire when the fallback rate goes above 12%, when token cost runs 30% above baseline, or when LLM-as-judge quality drops below 87%.
Layer 4: Canary Rollouts for Behavioural Changes
For an AI agent, a new deployment can be technically healthy and still show a behavioural regression. An AI canary goes to 5% of traffic first, and behavioural health monitoring runs for 24-48 hours while you compare fallback trigger rate and task completion rate against baseline. Promote the release to 100% only if the behavioural metrics sit within 5% of baseline. On AWS EKS we run canary and blue/green releases through a progressive delivery controller such as Argo Rollouts.
The Comparison: Traditional vs. AI-Native CI/CD
| Dimension | Traditional CI/CD | AI-Native CI/CD |
|---|---|---|
| What you test | Function outputs, API responses, DB queries | Code behaviour + LLM output quality (separate layers) |
| What "passing" means | Zero test failures | Zero test failures AND eval score above threshold |
| What you version | Application code | Application code + prompts + model version (all three) |
| Deployment gate | Tests pass + linting clean | Tests pass + eval suite passes + code review on prompt changes |
| Production monitoring | Uptime, latency, error rate | Uptime + behavioural metrics: hallucination rate, fallback rate, completion rate |
| Canary success criteria | No errors, normal latency | No errors + behavioural metrics match baseline within threshold |
| Rollback trigger | Error rate spike | Error rate spike OR behavioural regression |
| Compliance logging | Request/response logs | Full LLM trace: prompt, completion, token count, confidence, model version |
EU AI Act Compliance and Audit Logging
For clients in the EU, the EU AI Act has applied since 2 August 2026, but after the Digital Omnibus on AI (Regulation (EU) 2026/1744) its high risk system rules apply from 2 December 2027 for Annex III uses and from 2 August 2028 for AI in Annex I regulated products. High risk AI systems must support automatic event logging over their lifetime so their functioning can be traced, and they need technical documentation of the model and training data and human oversight mechanisms. Across the education, hospitality and enterprise SaaS products where we run AI in production, the logging fields differ by rulebook, such as the EU AI Act, the MAS guidance in Singapore or HIPAA for US health data, but in every case your CI/CD pipeline must produce traceable records of AI decision making.
What We Use in Practice
| Function | Tool | Notes |
|---|---|---|
| CI orchestration | GitHub Actions | Standard pipelines for code + eval runner |
| Containerisation | Docker + Kubernetes (AWS EKS) | Same as traditional; no change needed |
| LLM evaluation | LangSmith | Trace capture, eval runs, golden set management |
| Semantic evaluation | Custom Python (Ragas for RAG) | For RAG quality metrics |
| Monitoring | Prometheus + Grafana | Custom dashboards for behavioural metrics |
| Alerting | PagerDuty via Grafana | Thresholds on behavioural + technical metrics |
| Deployment | Progressive delivery controller on AWS EKS, such as Argo Rollouts (blue/green + canary) | Extended behavioural health check period |
Our MCP in production guide goes deeper on production AI agent architecture at the application layer, and the AI agent development cost breakdown gives realistic ranges for DevOps setup in AI projects. When cloud infrastructure and DevOps work covers AI applications in regulated markets, the logging architecture has to be designed before the first deployment.
Frequently Asked Questions
Do I need a completely separate CI/CD pipeline for AI applications?
No. You keep your existing pipeline and add two layers to it, namely an evaluation suite for LLM behaviour and AI-specific monitoring. The underlying CI/CD toolchain (GitHub Actions, Docker, Kubernetes) stays the same.
How do I test LLM output quality in CI without it being too slow or expensive?
Run evaluations against a golden test set of 50-200 representative cases instead of the full production traffic corpus. A golden set run typically completes in 3-8 minutes, and for most projects each run costs $1-5.
What happens when the LLM provider updates the underlying model?
Pin your model to a specific version in your configuration. When a new model version is available, run your full evaluation suite against it before upgrading. Some model updates improve average performance while degrading on specific input categories.
How do prompt changes get reviewed in a team environment?
Treat prompts as code. All prompt changes go through pull request review with a description of the intended behavioural change. The CI pipeline runs the evaluation suite on the proposed prompt change and fails the build if the eval score drops below threshold.
What is the minimum monitoring setup for a production AI agent?
At minimum, log every LLM request with its timestamp, model version, prompt version, token count and latency. Track fallback trigger rate, task completion rate and token cost per session, and set an alert that fires when the fallback rate exceeds 10-15%.
Does this apply to AI features embedded in traditional apps, not just standalone AI agents?
Yes. Any application component that calls an LLM and uses the output for a user-facing function requires AI-native evaluation and monitoring.