
















What is business intelligence dashboard development?
Business intelligence dashboard development is the work of turning the data a company already has into a live decision tool, namely the pipelines that collect and clean the data, the model that defines the metrics, and the dashboard where teams see KPIs, drill into causes, and act. A BI dashboard development company designs and builds that whole chain, from source systems to the screen an operator or executive actually uses.
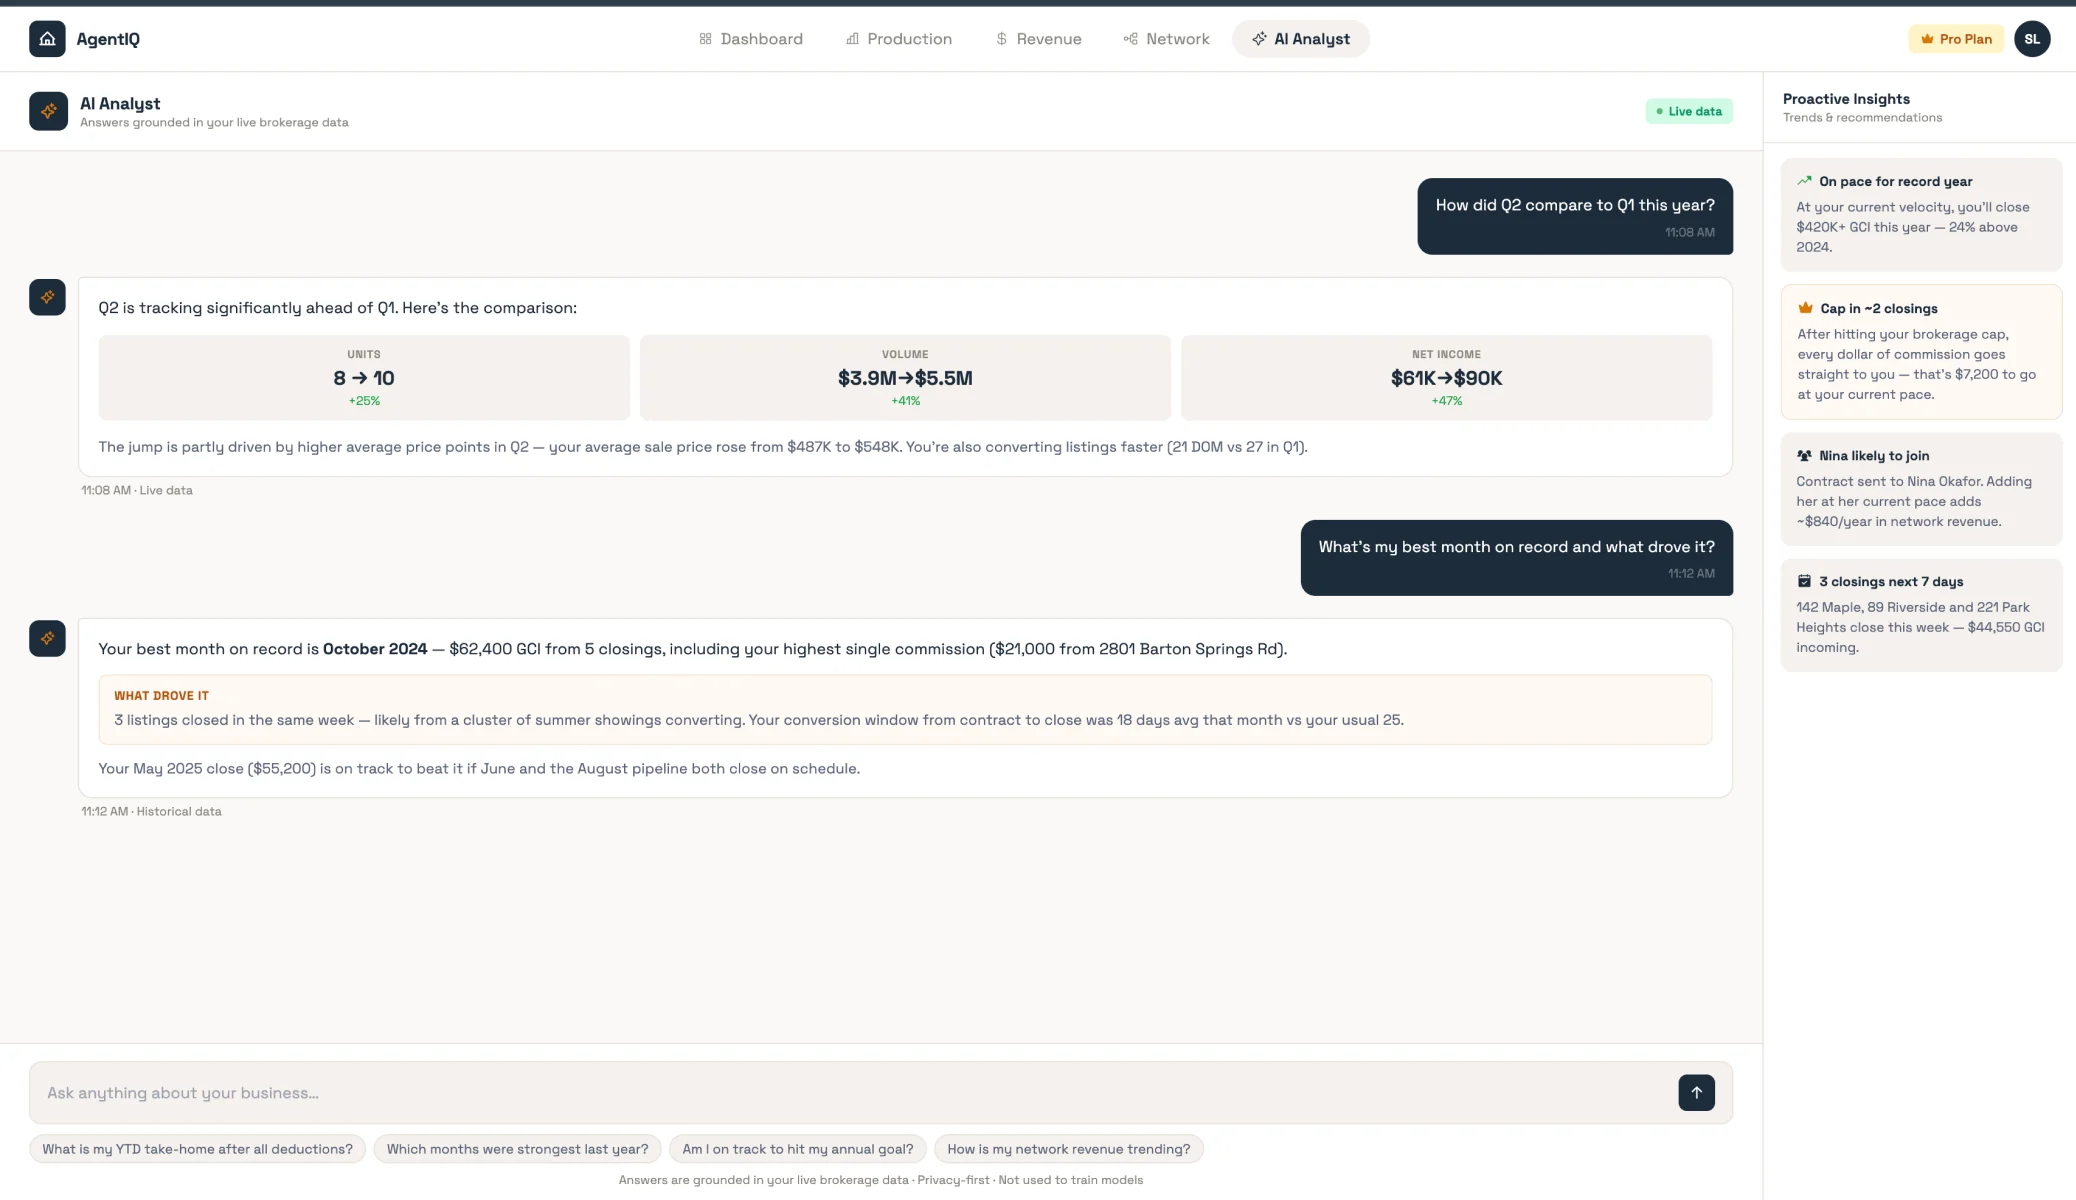
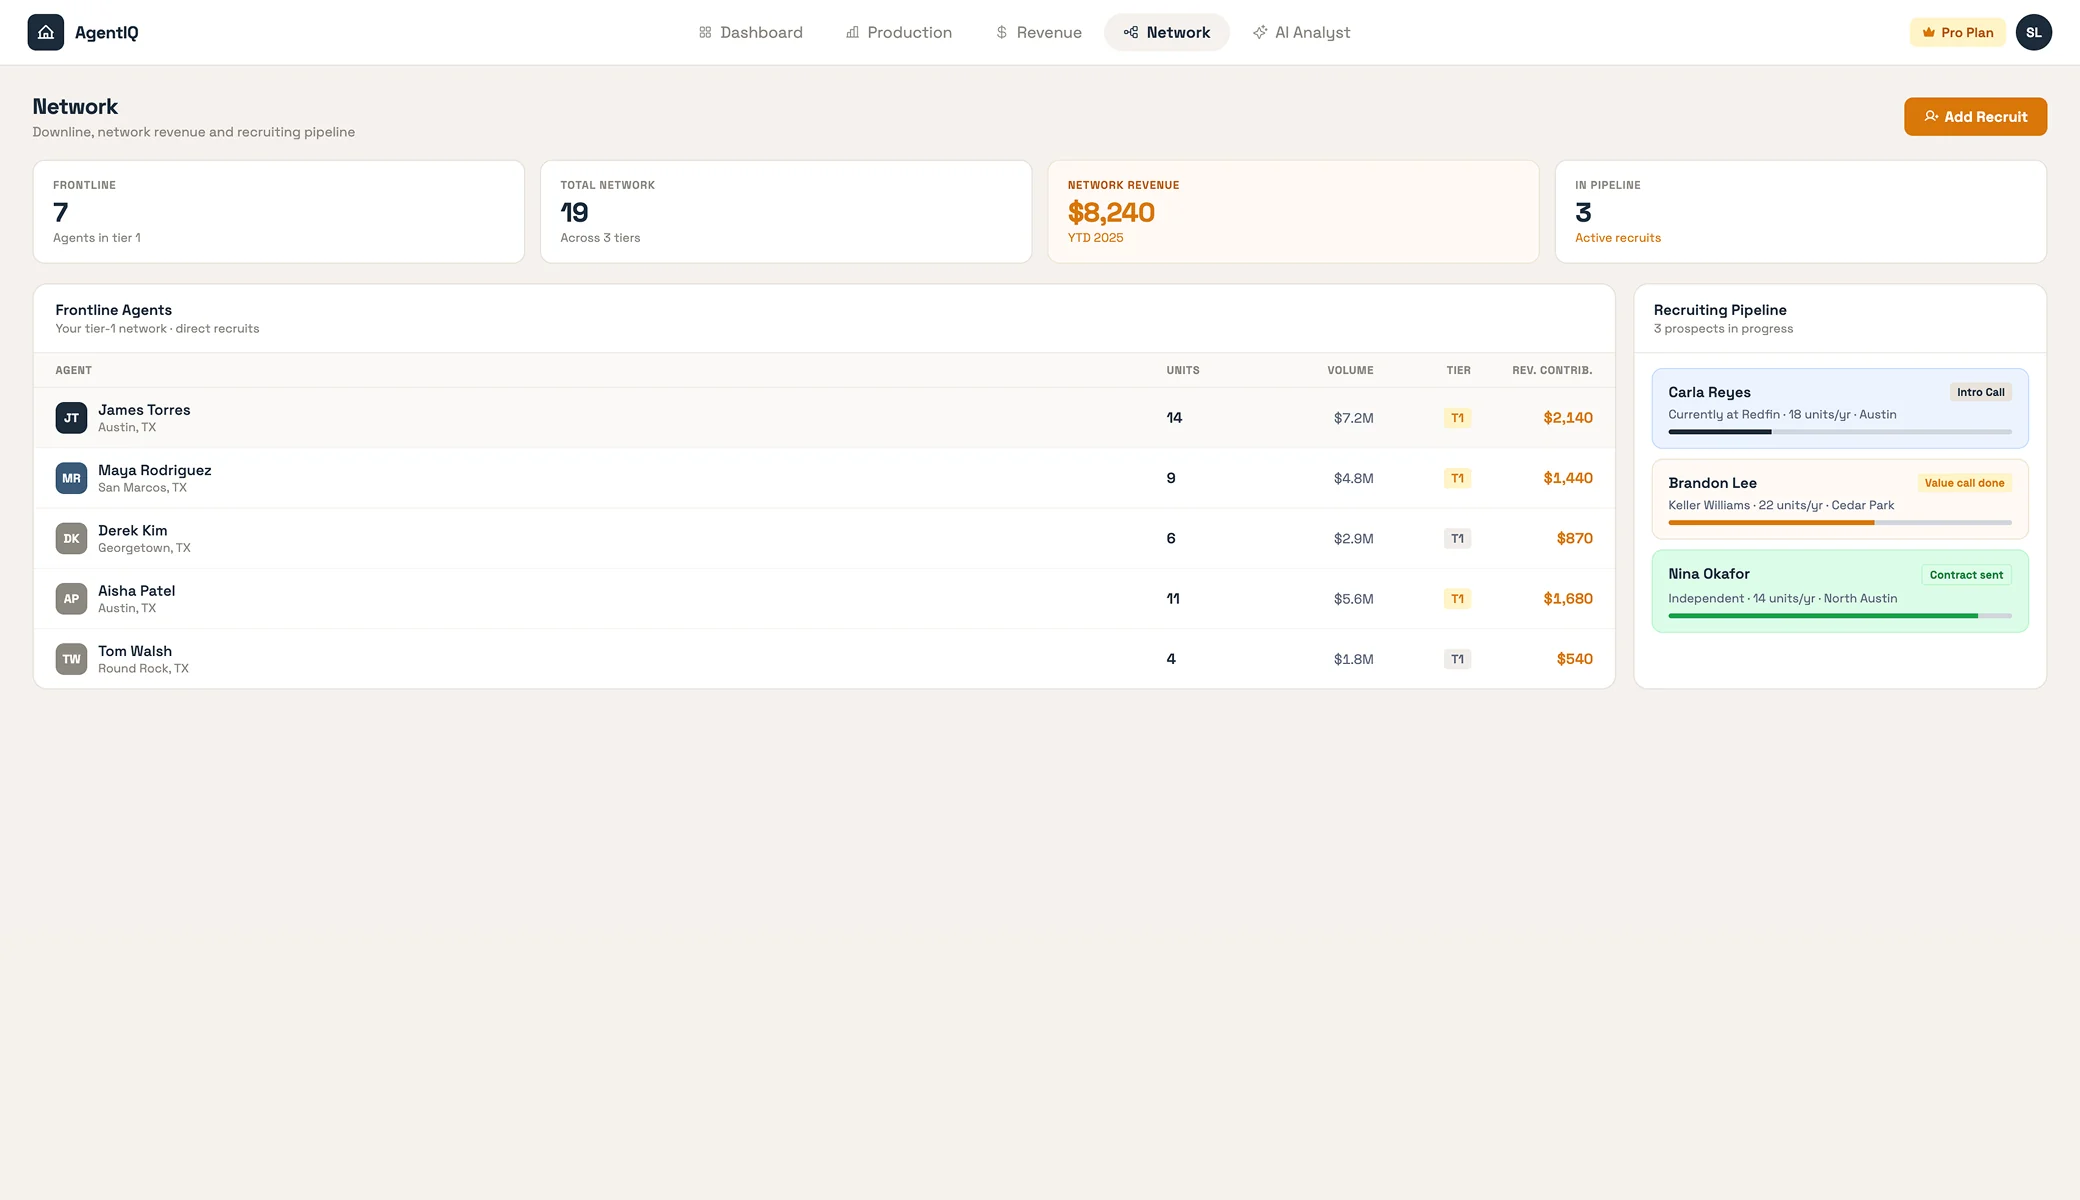
Unico Connect builds custom business intelligence dashboards for companies that outgrew spreadsheets and one size fits all BI tools. Our work spans real time KPI dashboards, analytics embedded inside SaaS products, and conversational AI analysts that answer questions from live business data. One of our US clients replaced quarterly reconciliation with real time KPIs and an AI analyst grounded in live brokerage data, and a consumer brands platform we built cut stockouts 30 percent with demand forecasting and an analytics bot. For the concepts behind good dashboards, see our guide to business intelligence dashboards, and for the wider data practice see data analytics and science.
Why Most Dashboard Projects Stall
A Typical Dashboard Project
Charts before questions
A tool gets configured around available data instead of the decisions the business needs to make.
No agreed definitions
Two teams compute the same KPI differently, so nobody trusts any number on the screen.
Stale or broken pipelines
Data loads by hand or breaks silently, and the dashboard quietly drifts from reality.
Analyst only tooling
The people who need answers cannot use the tool, so decisions go back to spreadsheets.
Vendor locked data
Metrics live inside a platform you rent, and leaving means starting over.
How We Build BI Dashboards
Decision first scoping
We start from the decisions the dashboard must support and work back to the data.
One metric dictionary
KPI definitions agreed once, computed once, and reconciled against source systems.
Engineered pipelines
Automated, monitored data flows with freshness that matches the decision, not a nightly batch by default.
Built for the actual users
Custom front ends and AI analysts for operators and executives, not just analysts.
Owned, not rented
You own the code, pipelines, and infrastructure, ISO 27001 certified delivery throughout.
What We Build

Custom KPI Dashboards
Executive and operational dashboards with agreed metric definitions, drill downs, and alerting on the numbers that matter.

Embedded Analytics for SaaS
Analytics that live inside your product as a feature your customers use, with per tenant isolation and your branding.

Conversational AI Analysts
Ask a question in plain language and get an answer computed from live data, grounded so the model cannot invent figures.

Data Pipelines & Integration
Automated flows from your source systems, CRMs, ERPs, databases, and files, into one reconciled model.

Real Time Operations Dashboards
Live views for fleets, bookings, inventory, and service operations where yesterday is too late.

Dashboard Rescue & Modernization
Fixing the dashboard nobody trusts, from KPI definitions and broken pipelines to a front end people actually use.
BI Platforms We Have Shipped
Replaced quarterly reconciliation with real time KPIs and an AI analyst
Real time
KPIs from quarterly cycles
AI analyst
On live brokerage data
SaaS
Sold as a product
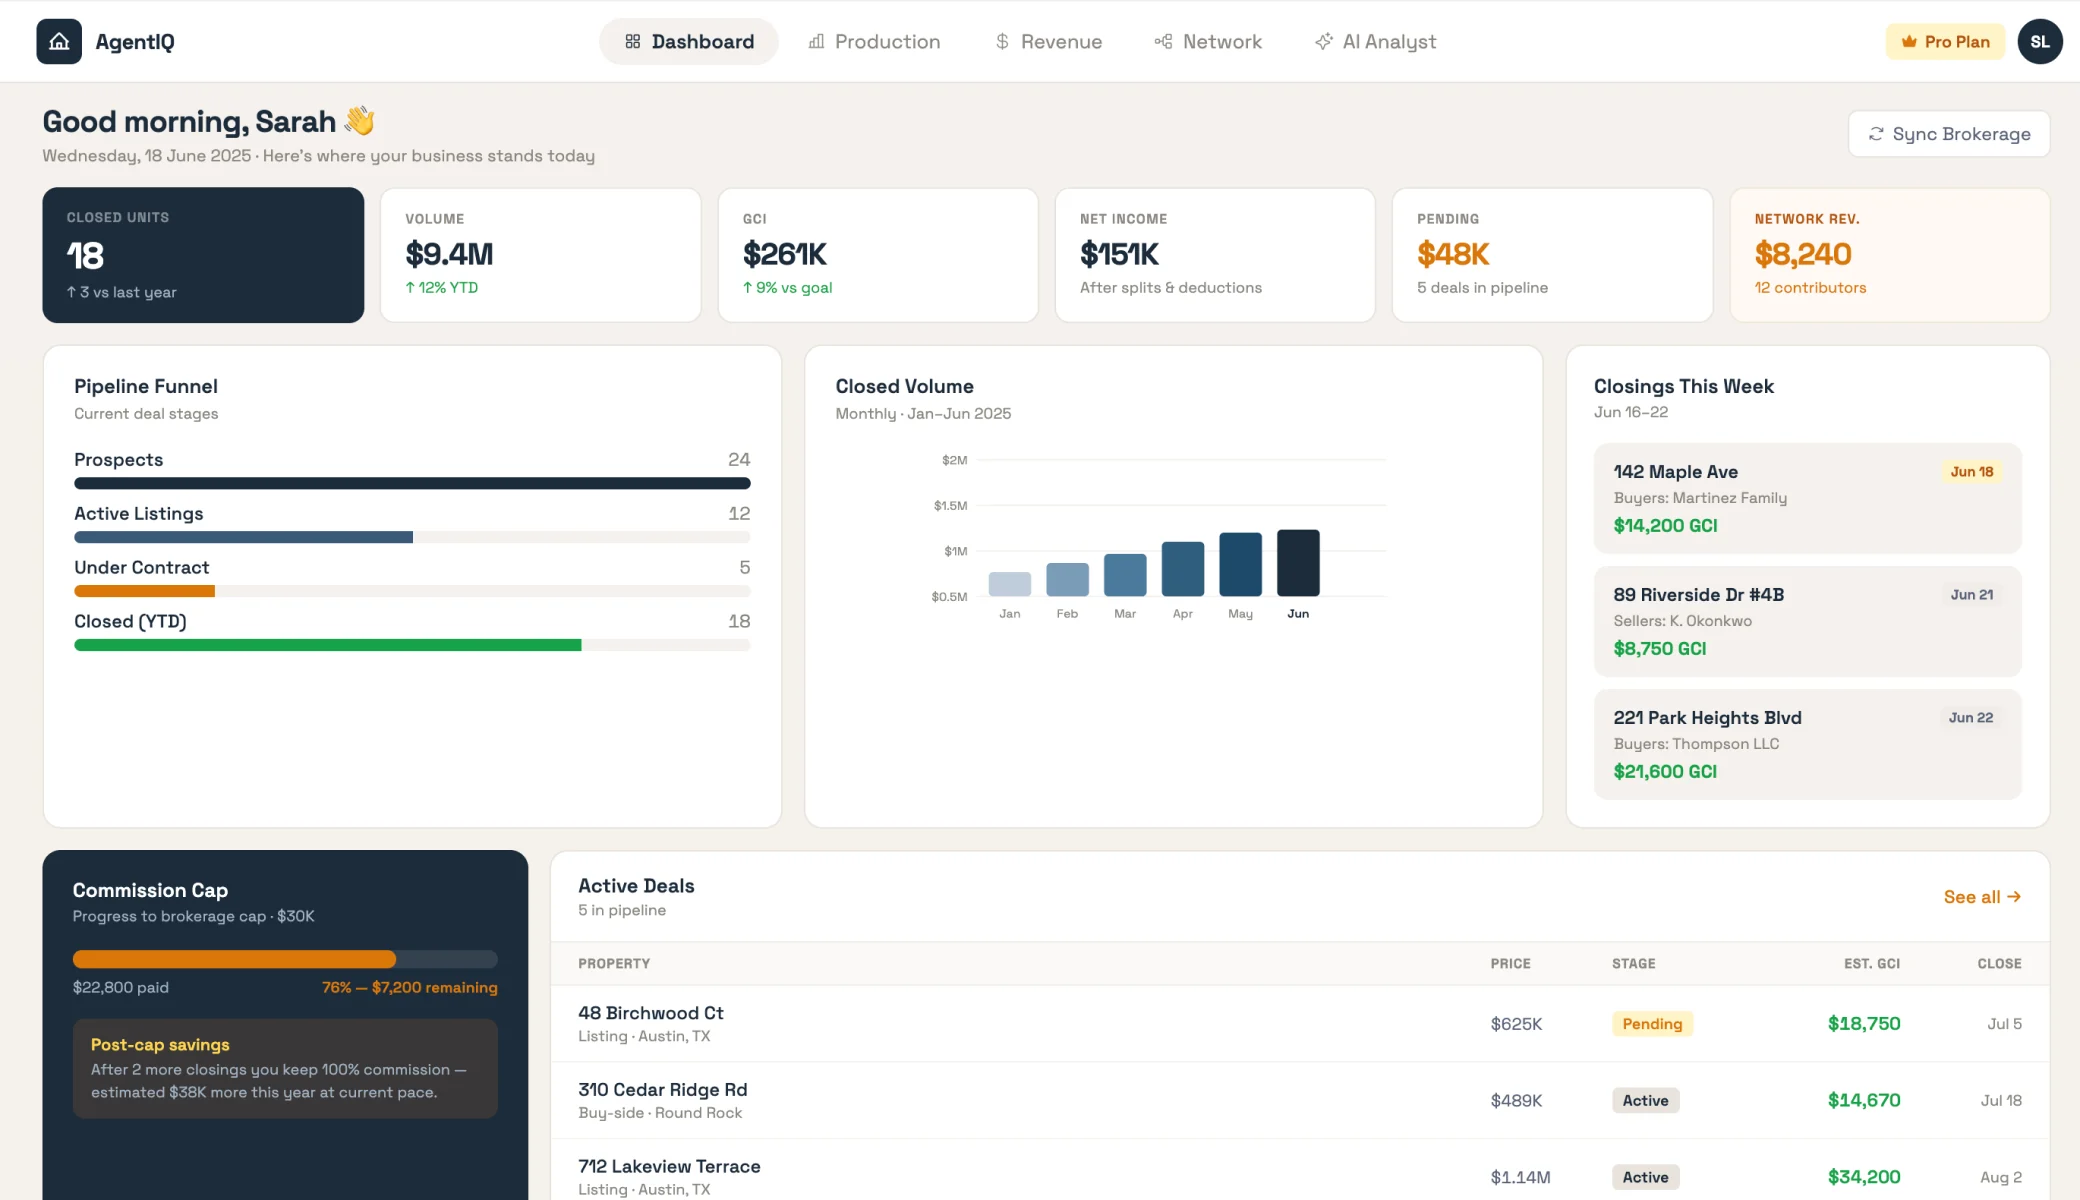
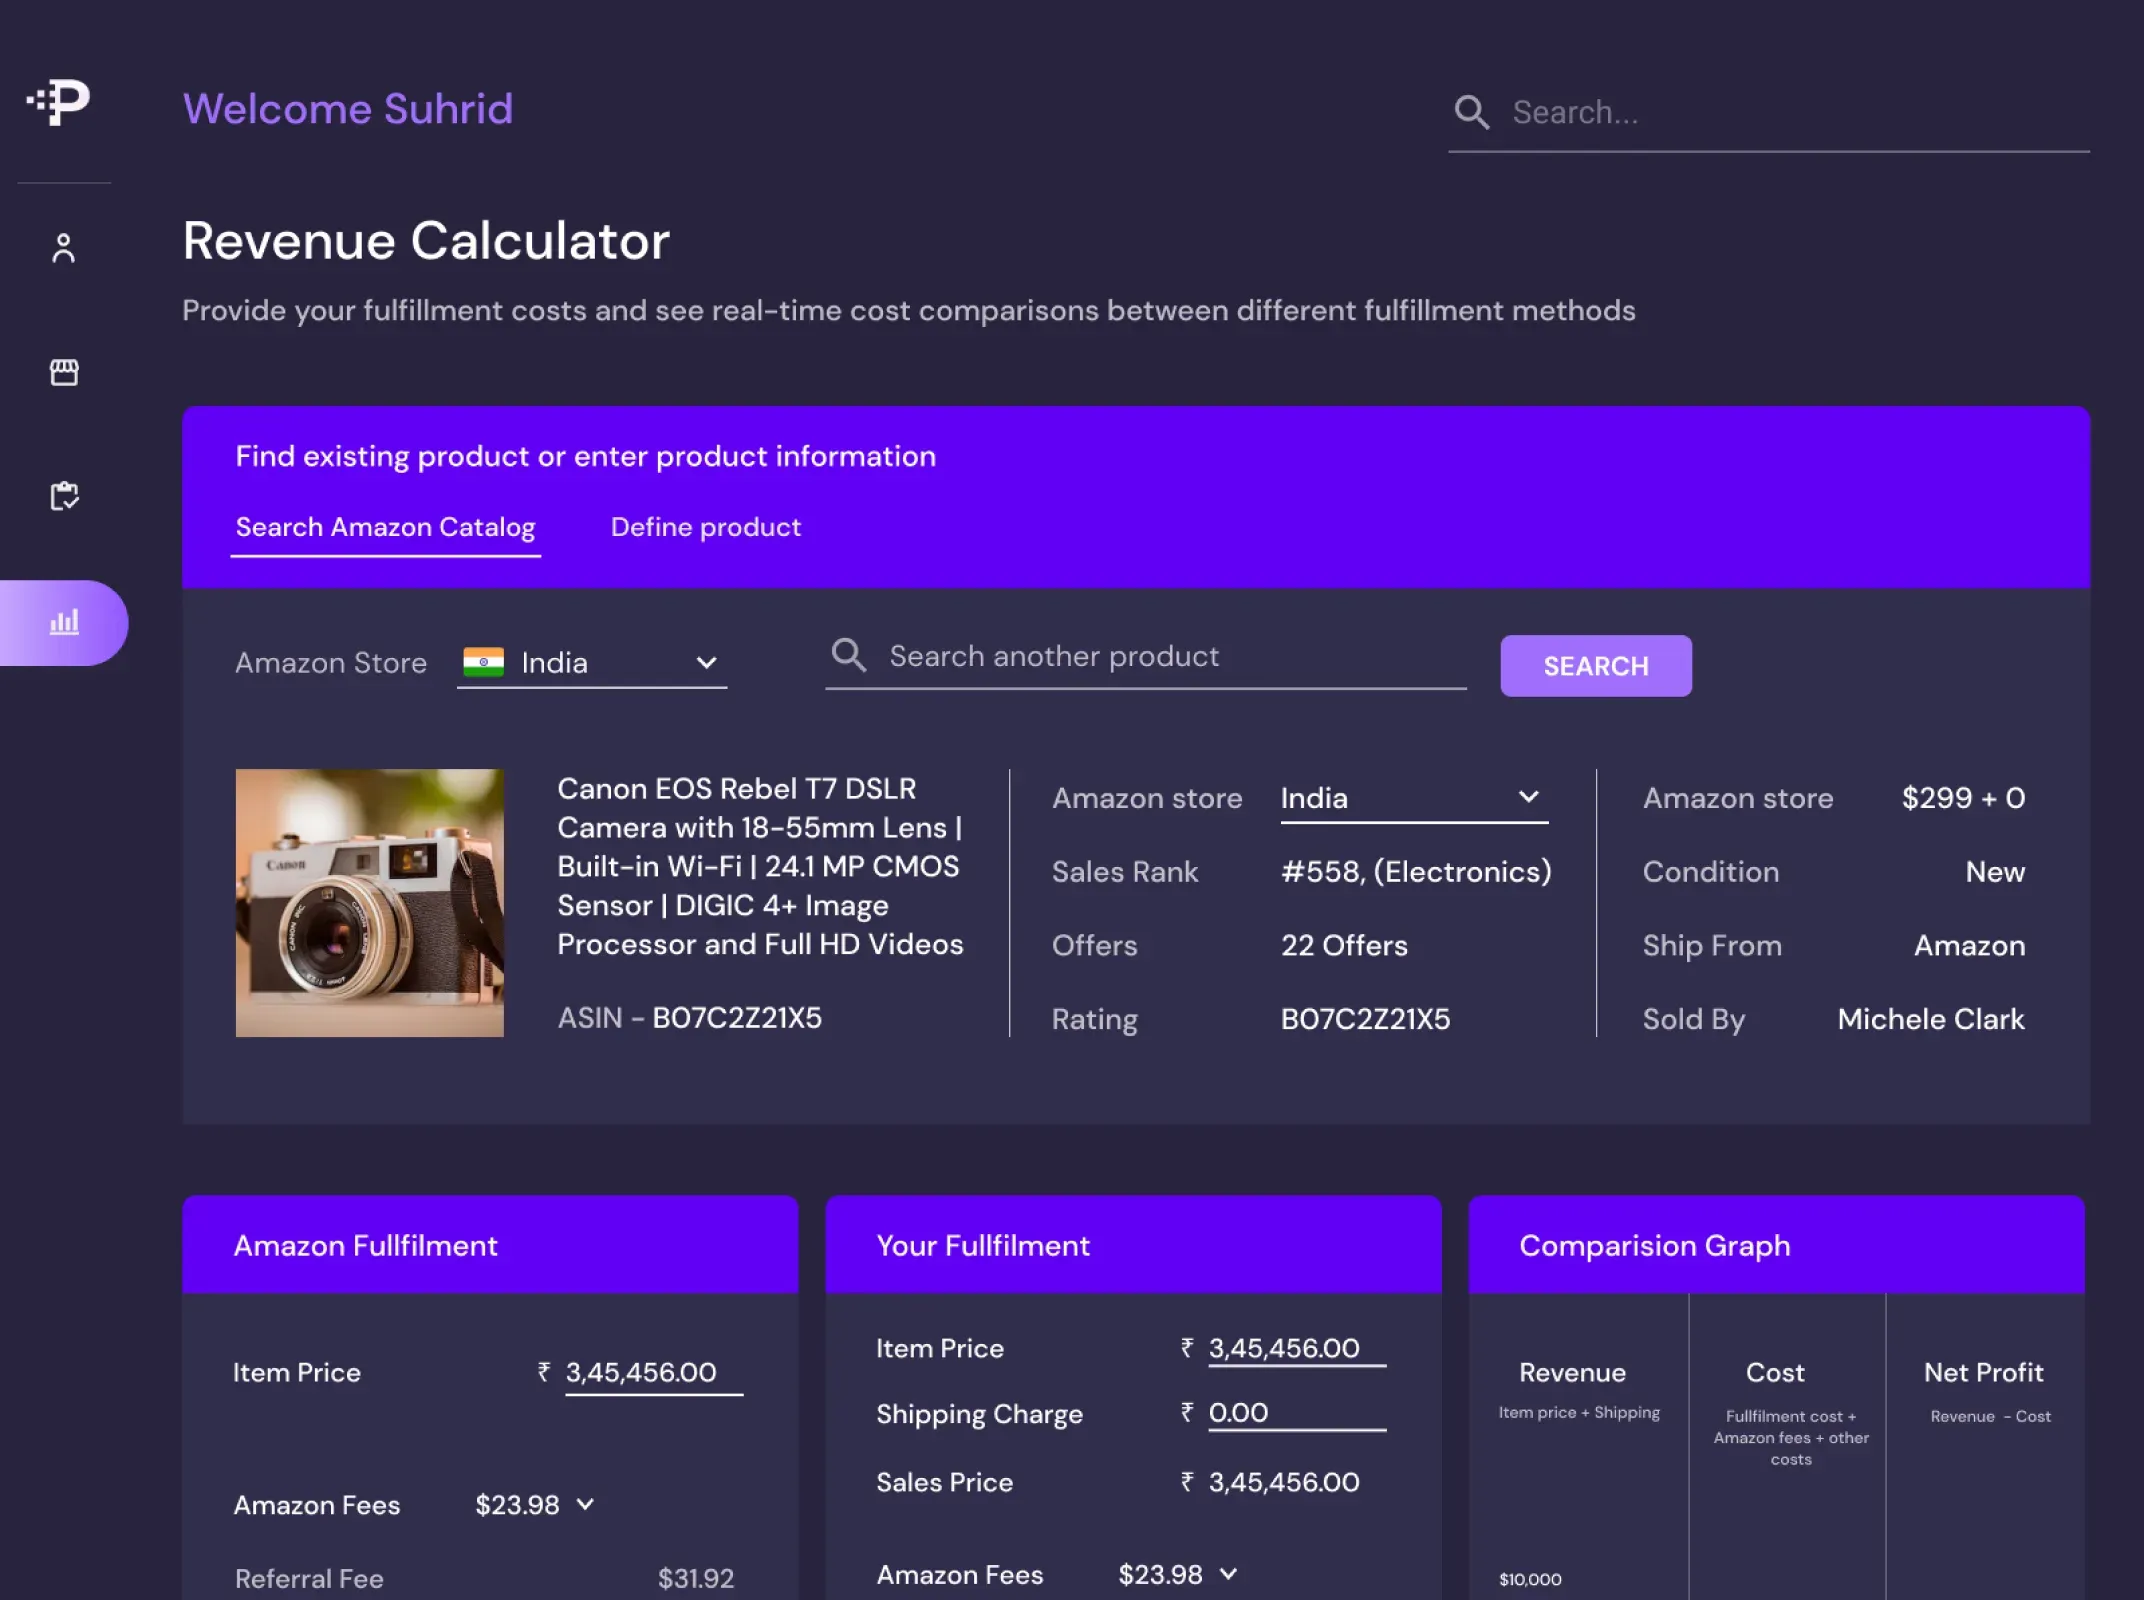
Cut stockouts 30 percent with demand forecasting and an analytics bot
-30%
Stockouts across brands
QueryAI
Analytics bot on live data
Multi
Marketplace coverage
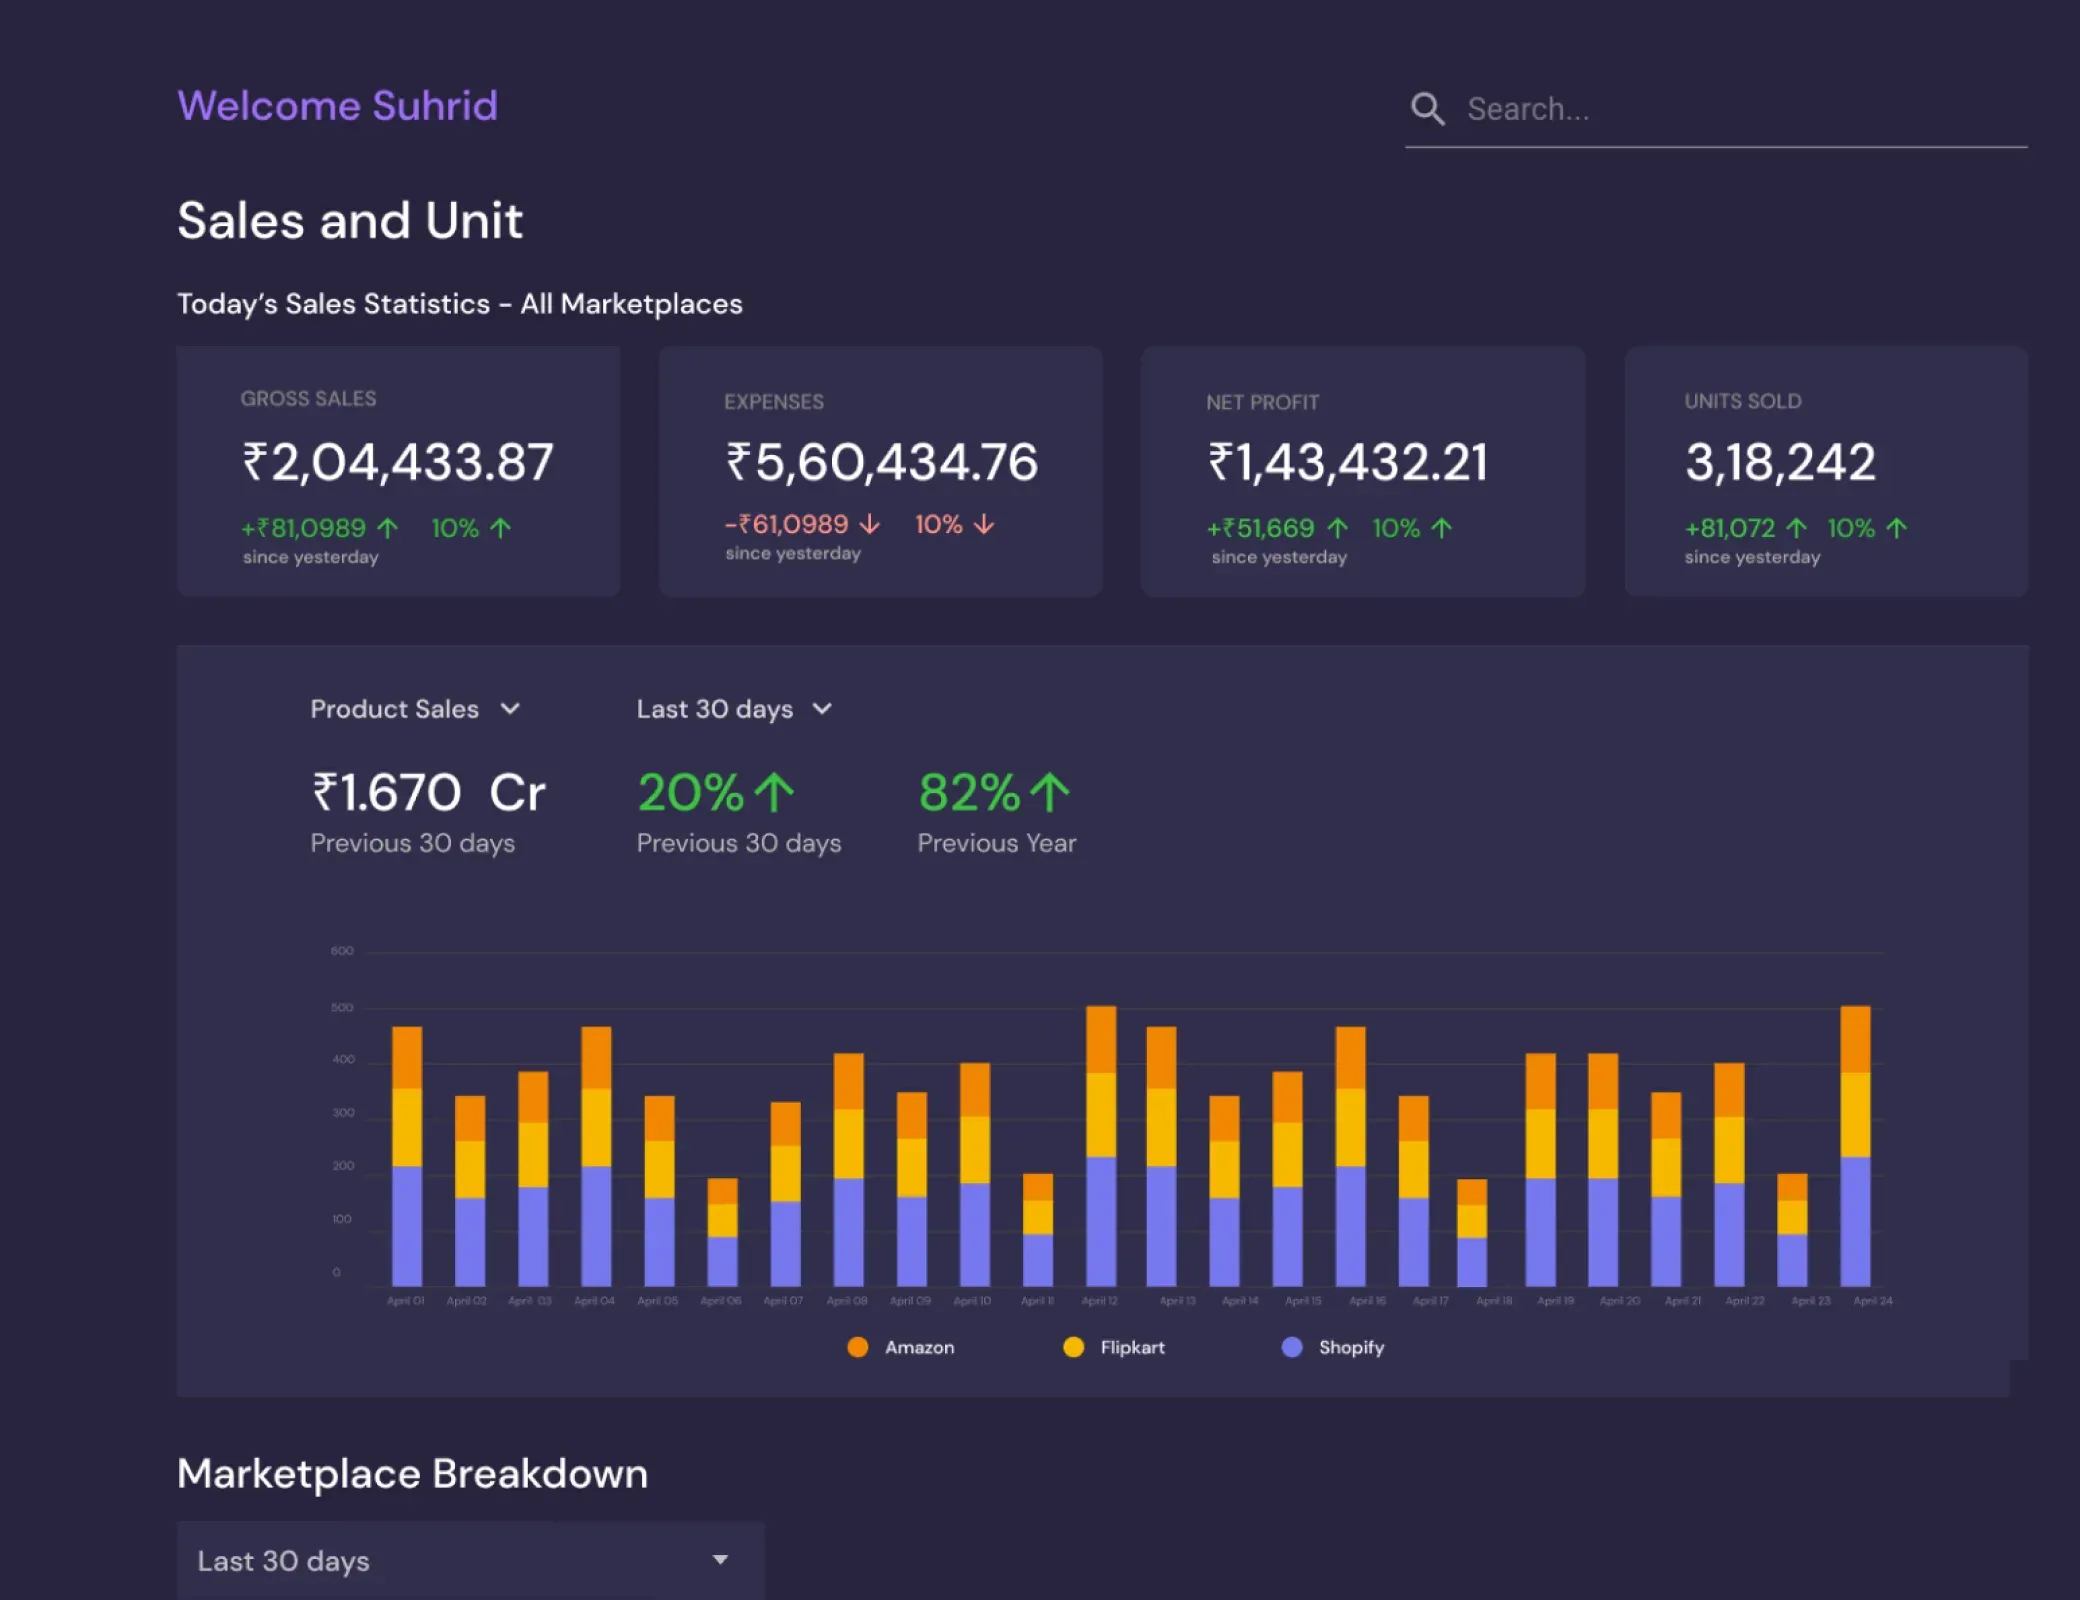
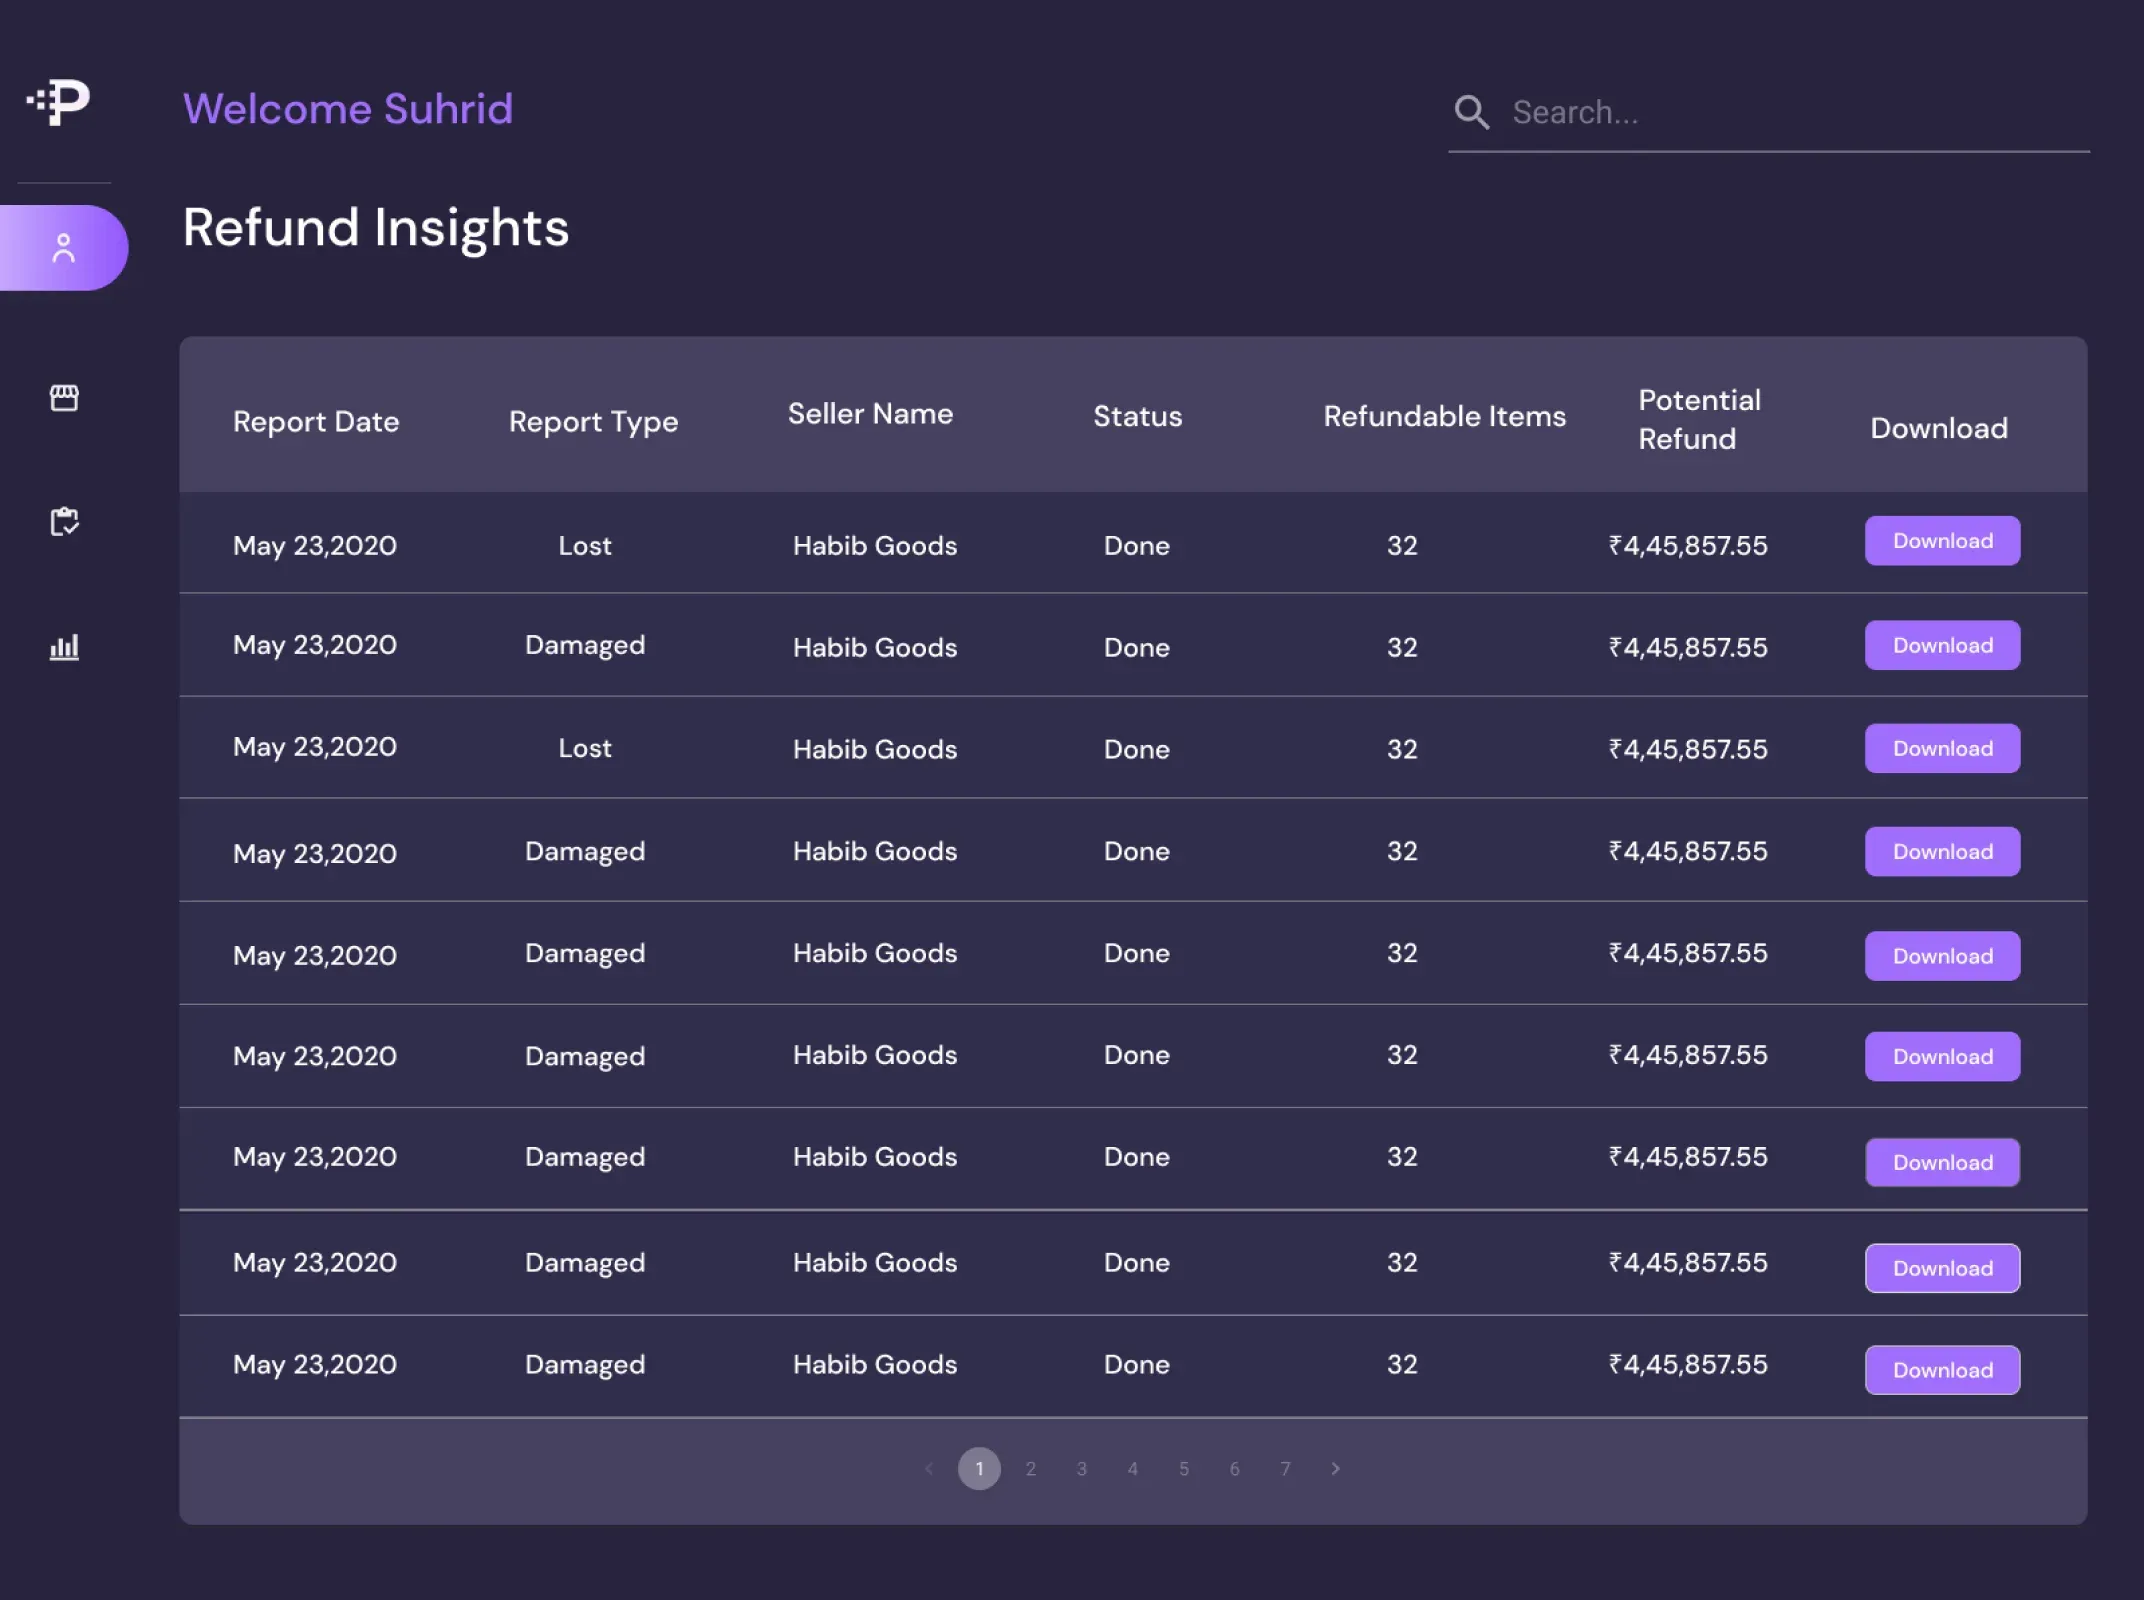
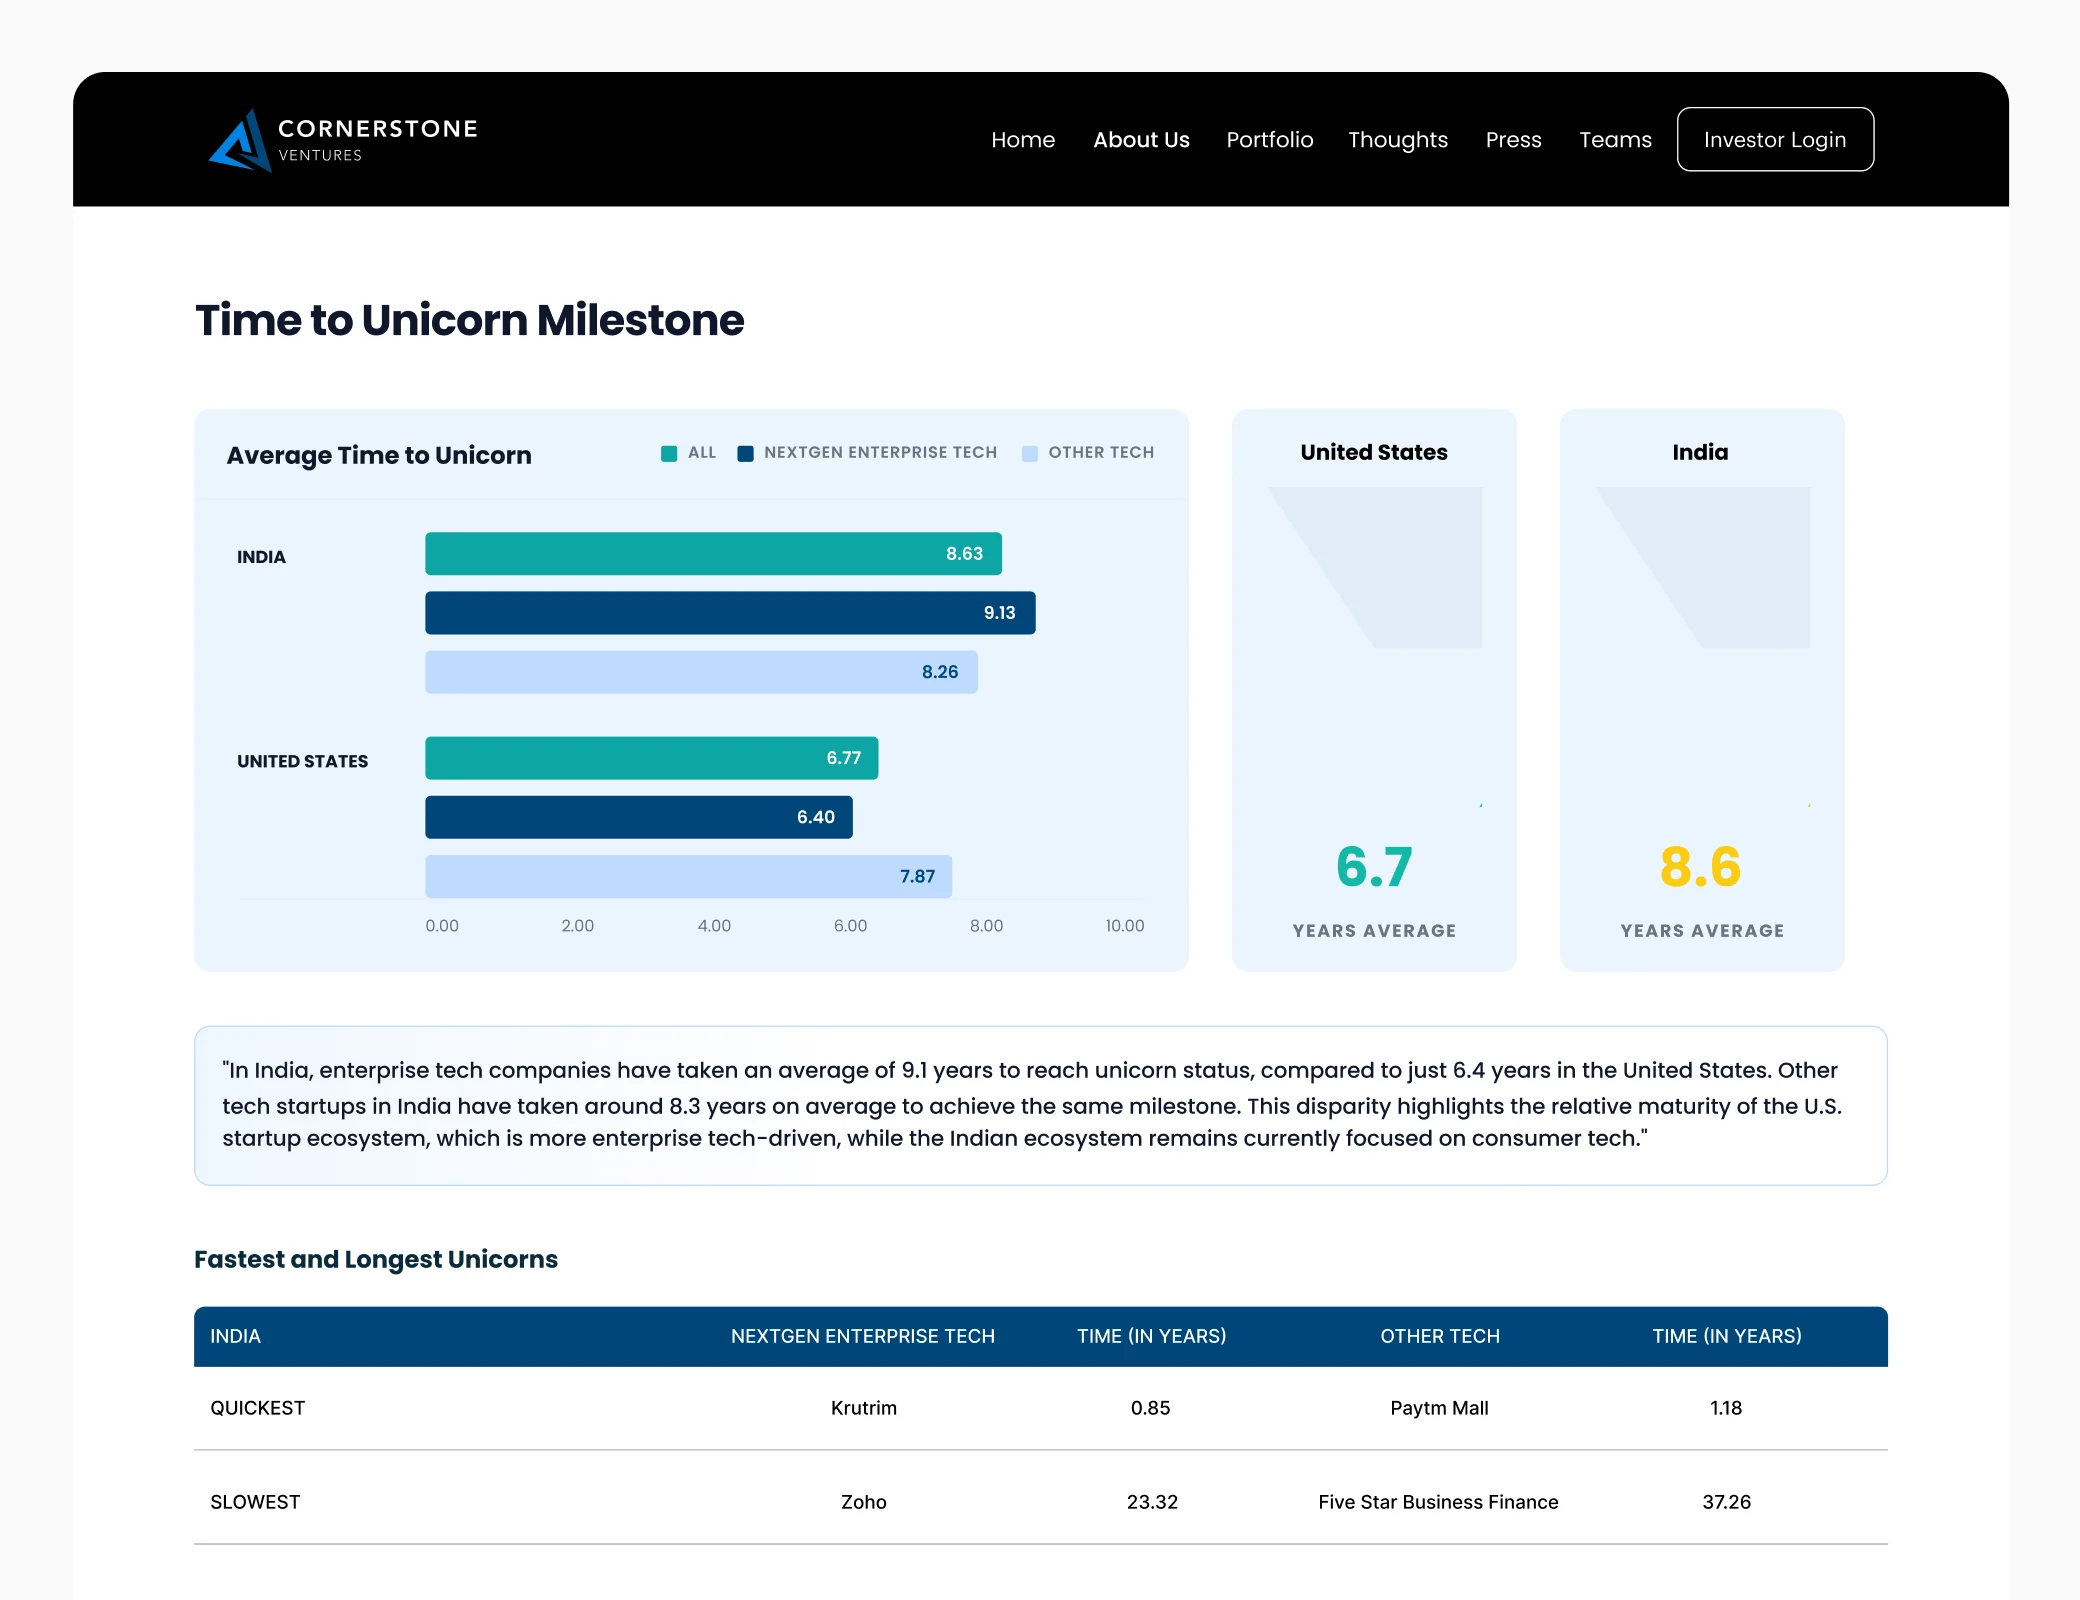
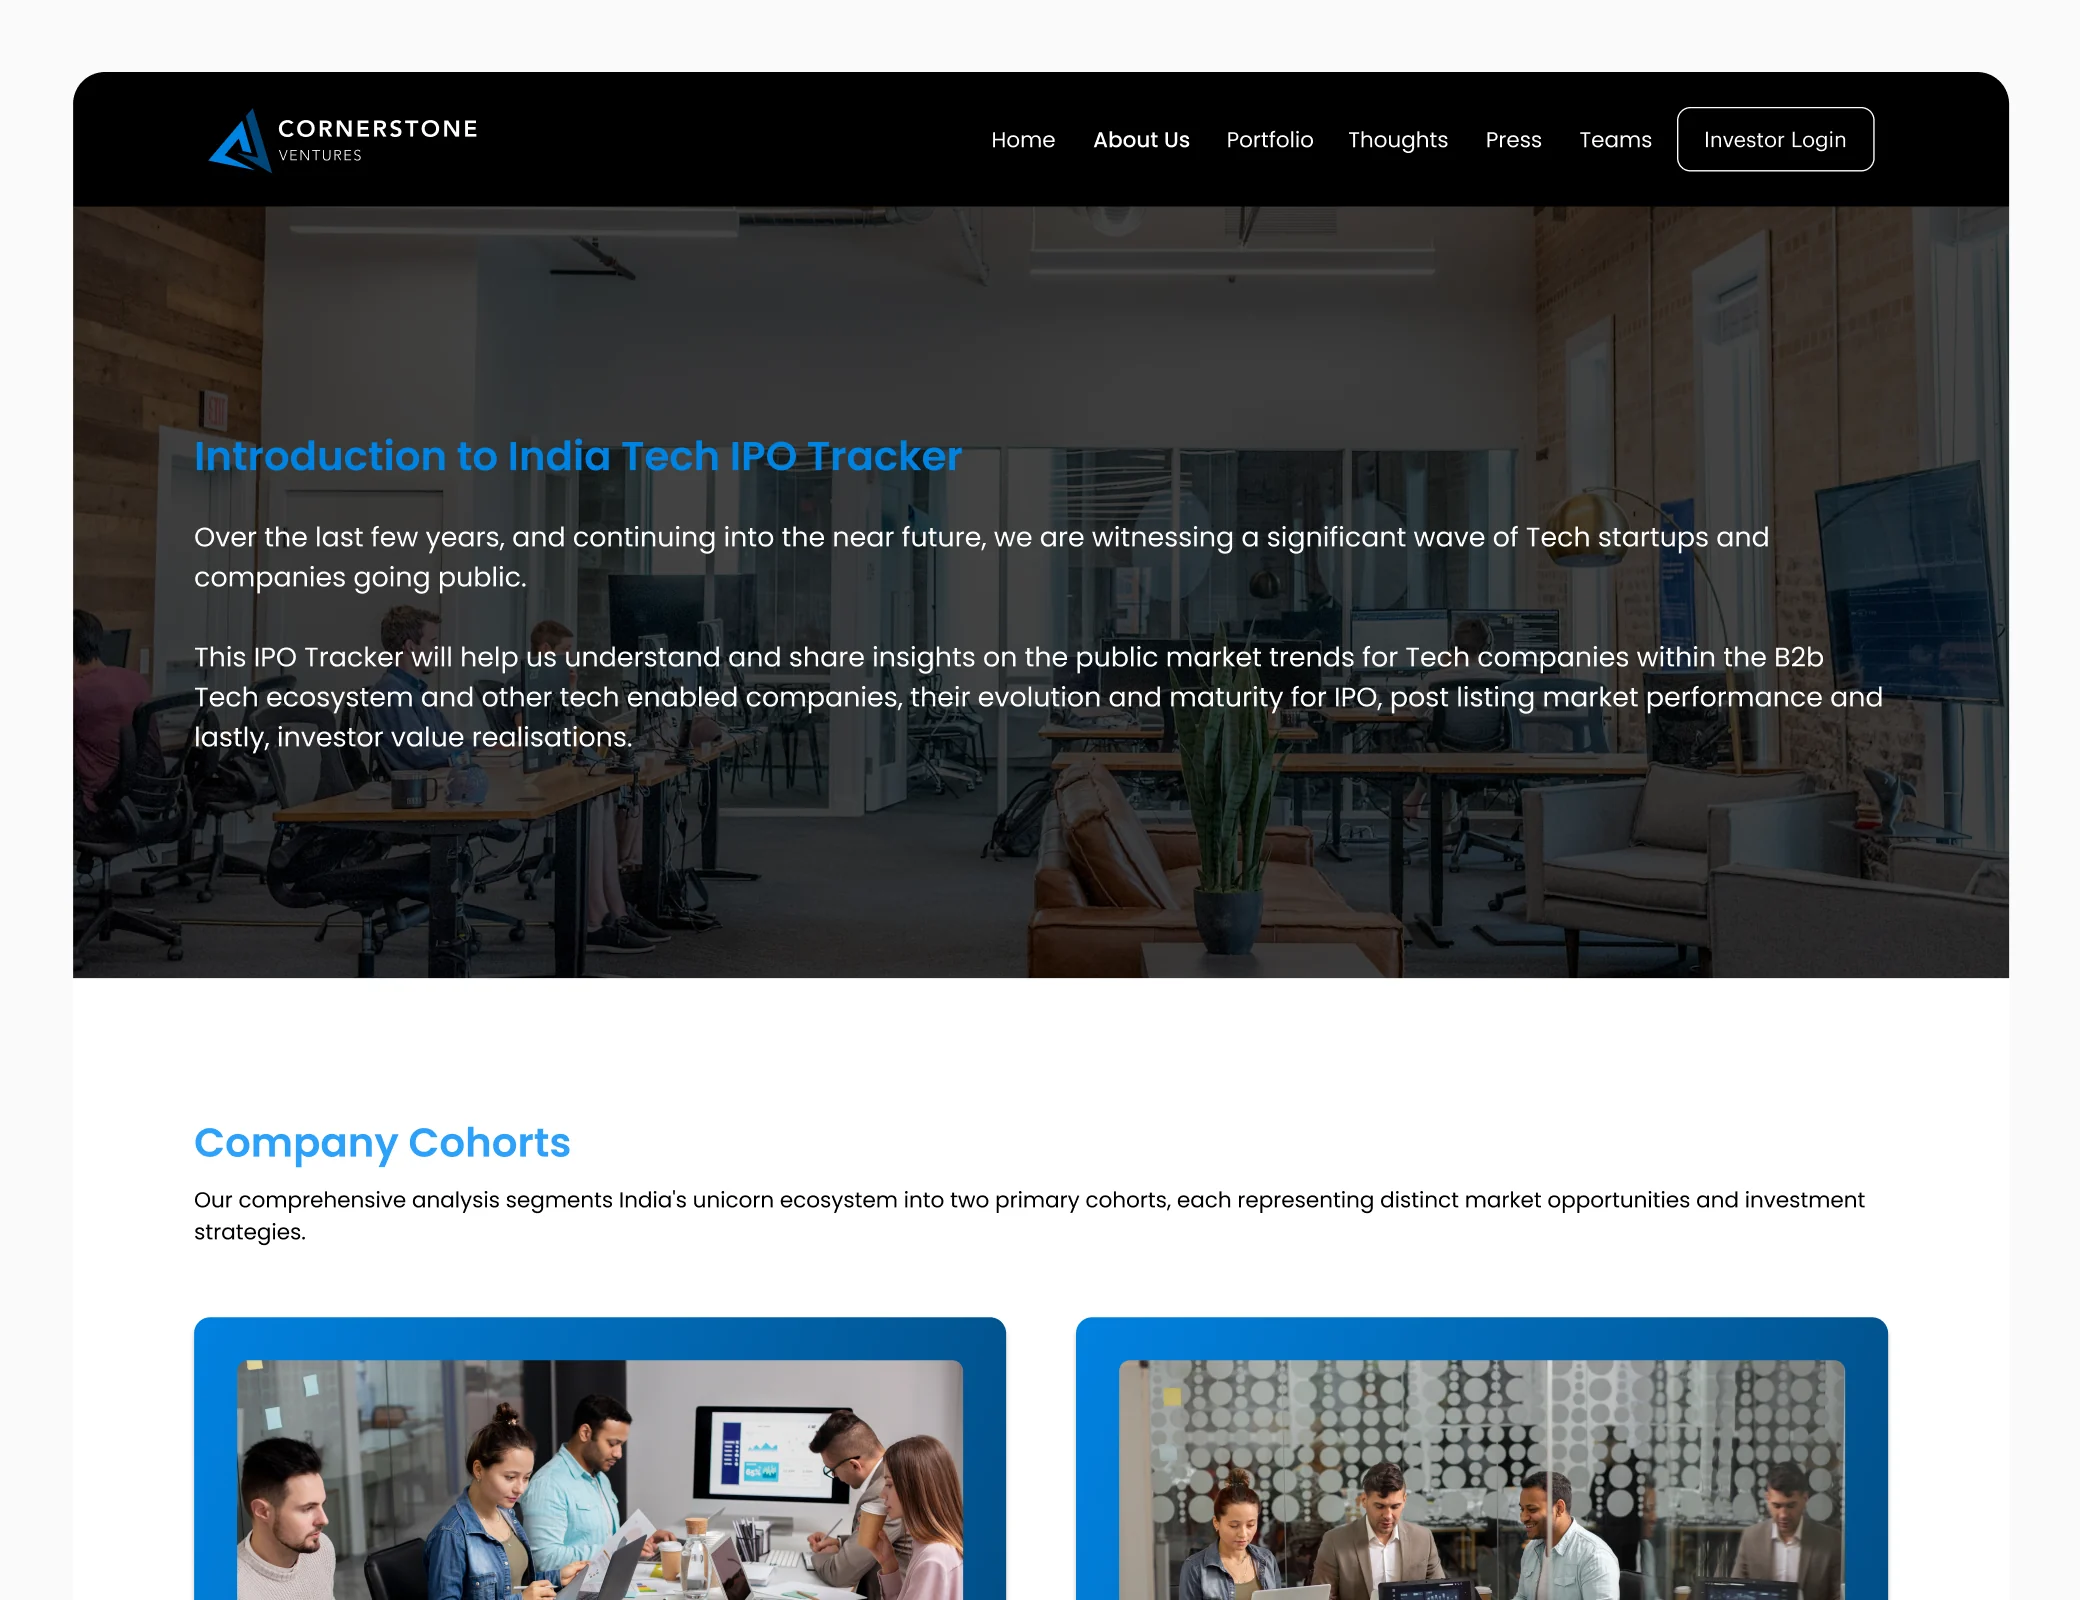
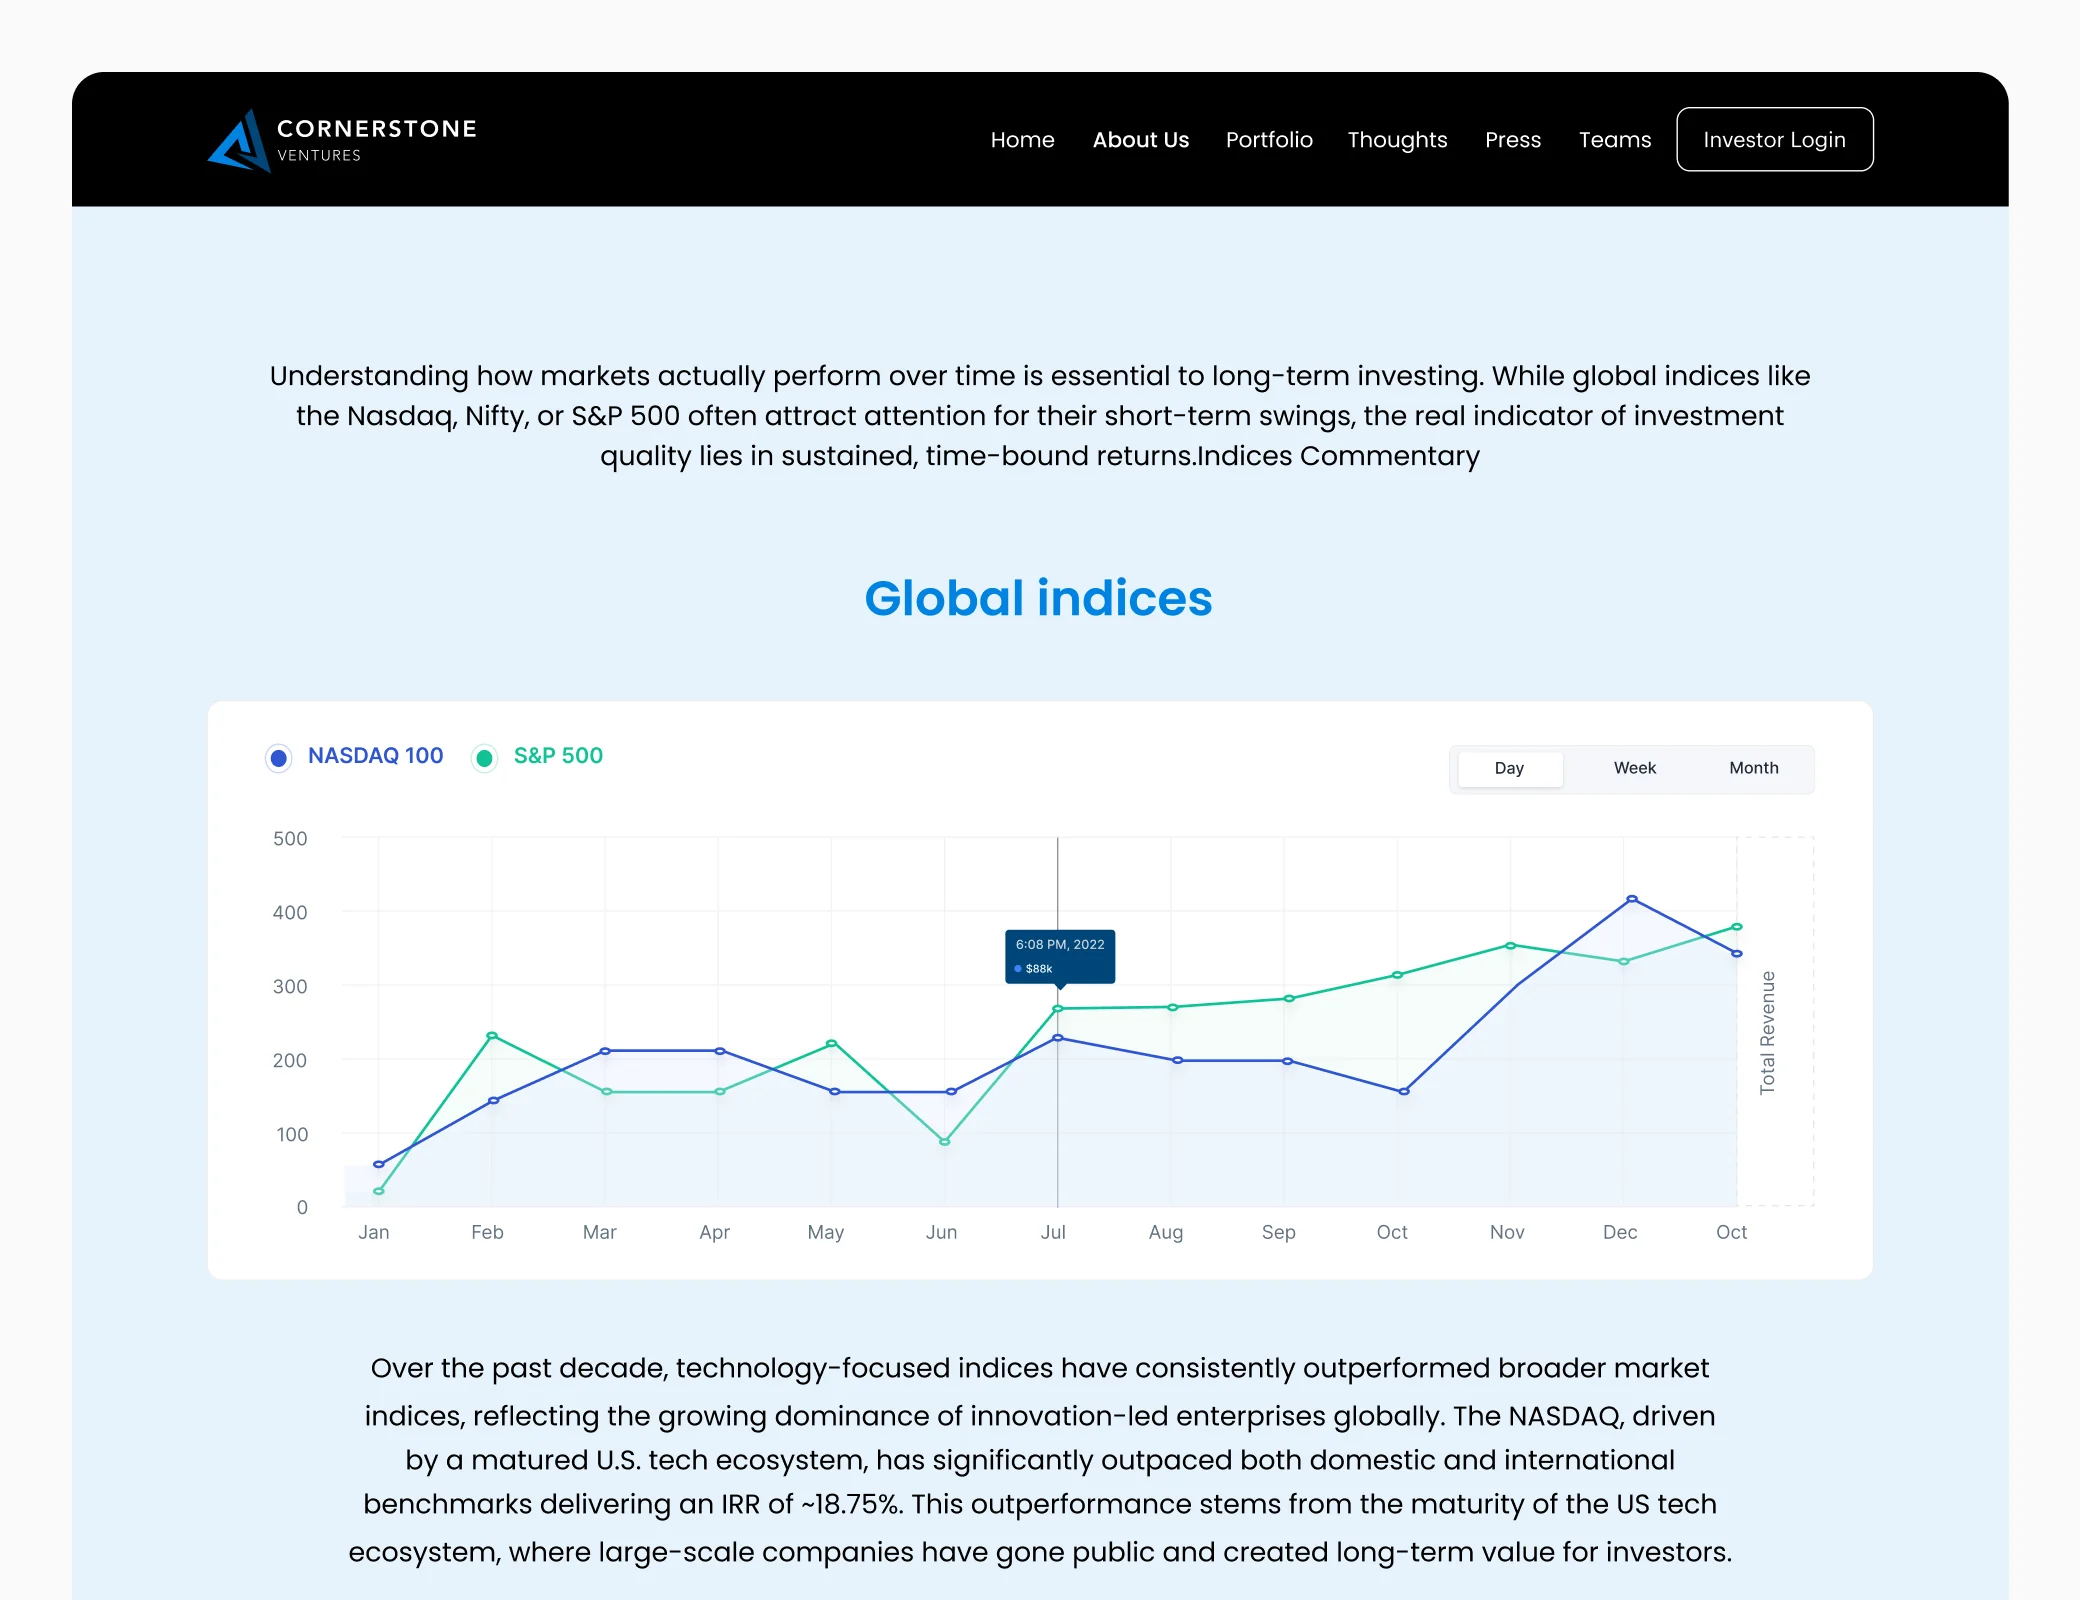
Gave a VC firm curated, current visibility into its whole portfolio
Portfolio
Intelligence for investors
Current
Curated live visibility
One
Platform, site included
How Should You Buy a BI Dashboard in 2026?
The market gives you three honest options, and the right one depends on who uses the dashboard and where it lives.
| Approach | Best when | Watch out for |
|---|---|---|
| Configure a BI platform (Power BI, Tableau) | Internal analysts, data already warehoused, standard visuals | Per seat licensing at scale, limits on custom interactions |
| Custom dashboard | Customer facing analytics, embedded in your product, AI features | Needs a real engineering partner, not a template shop |
| Hybrid | Warehouse plus platform for analysts, custom front end for everyone else | Requires one team that can do both sides |
What separates a dashboard that gets used from one that gets ignored. The failure mode is familiar. A tool gets bought, charts get configured, and six months later decisions are still made in spreadsheets because nobody trusts the numbers. Trust comes from the unglamorous layer, namely agreed KPI definitions, pipelines that reconcile with the source systems, and data that is fresh enough for the decision at hand. That layer is engineering work, and it is where we spend most of a BI engagement.
Where AI genuinely changes BI. Two places. First, conversational analysts grounded in live data, so people who will never learn a filter panel can ask a question and get an answer computed from the real numbers. Second, anticipation rather than reporting, such as the demand forecasting we shipped for consumer brands that cut stockouts 30 percent. AI does not replace the data layer. It sits on top of it, which is why grounding and guardrails matter more in BI than anywhere else.
How an engagement runs. We start with the decision the dashboard has to support, not the chart list. Discovery defines the KPIs and finds where the data actually lives, a working slice ships in the first weeks with the most important view, and iteration expands coverage while your team starts using it. You own the code, the pipelines, and the infrastructure throughout, and our estimate ranges start from 15,000 dollars with a fixed scope agreed before we build. See how we ship on the data analytics practice, or ask us to walk you through the real estate BI platform build.

Still making decisions from spreadsheets?
Talk to our teamPRICING
Transparent pricing, published
$15,000 to $50,000
focused dashboards with pipeline work
$50,000 to $150,000+
embedded analytics and AI analyst platforms
Published estimate ranges at a blended rate of $25 to $50 per hour. Every project is scoped individually before any number becomes a quote.
See the software cost guide + calculatorBI Dashboard FAQs
A working decision tool, not a chart collection. That means the data model and pipelines that feed it, the KPI definitions your team agrees on, the dashboard itself with drill downs and alerts, role based access so people see what they should, and documentation so your team owns it. The dashboard is the visible part. Most of the engineering is in the data layer underneath it.
Data & Analytics Insights
View all blogs


Get a dashboard your team actually trusts
Tell us the decision you need visibility on. We will get back to you within one business day.
Prefer to book directly?
🗓️ Schedule on Calendly →Or email us
✉️sales@unicoconnect.com